Procedures for Testing with the DX Host
102 Baker DX 71-030 User Guide EN V10 www.megger.com
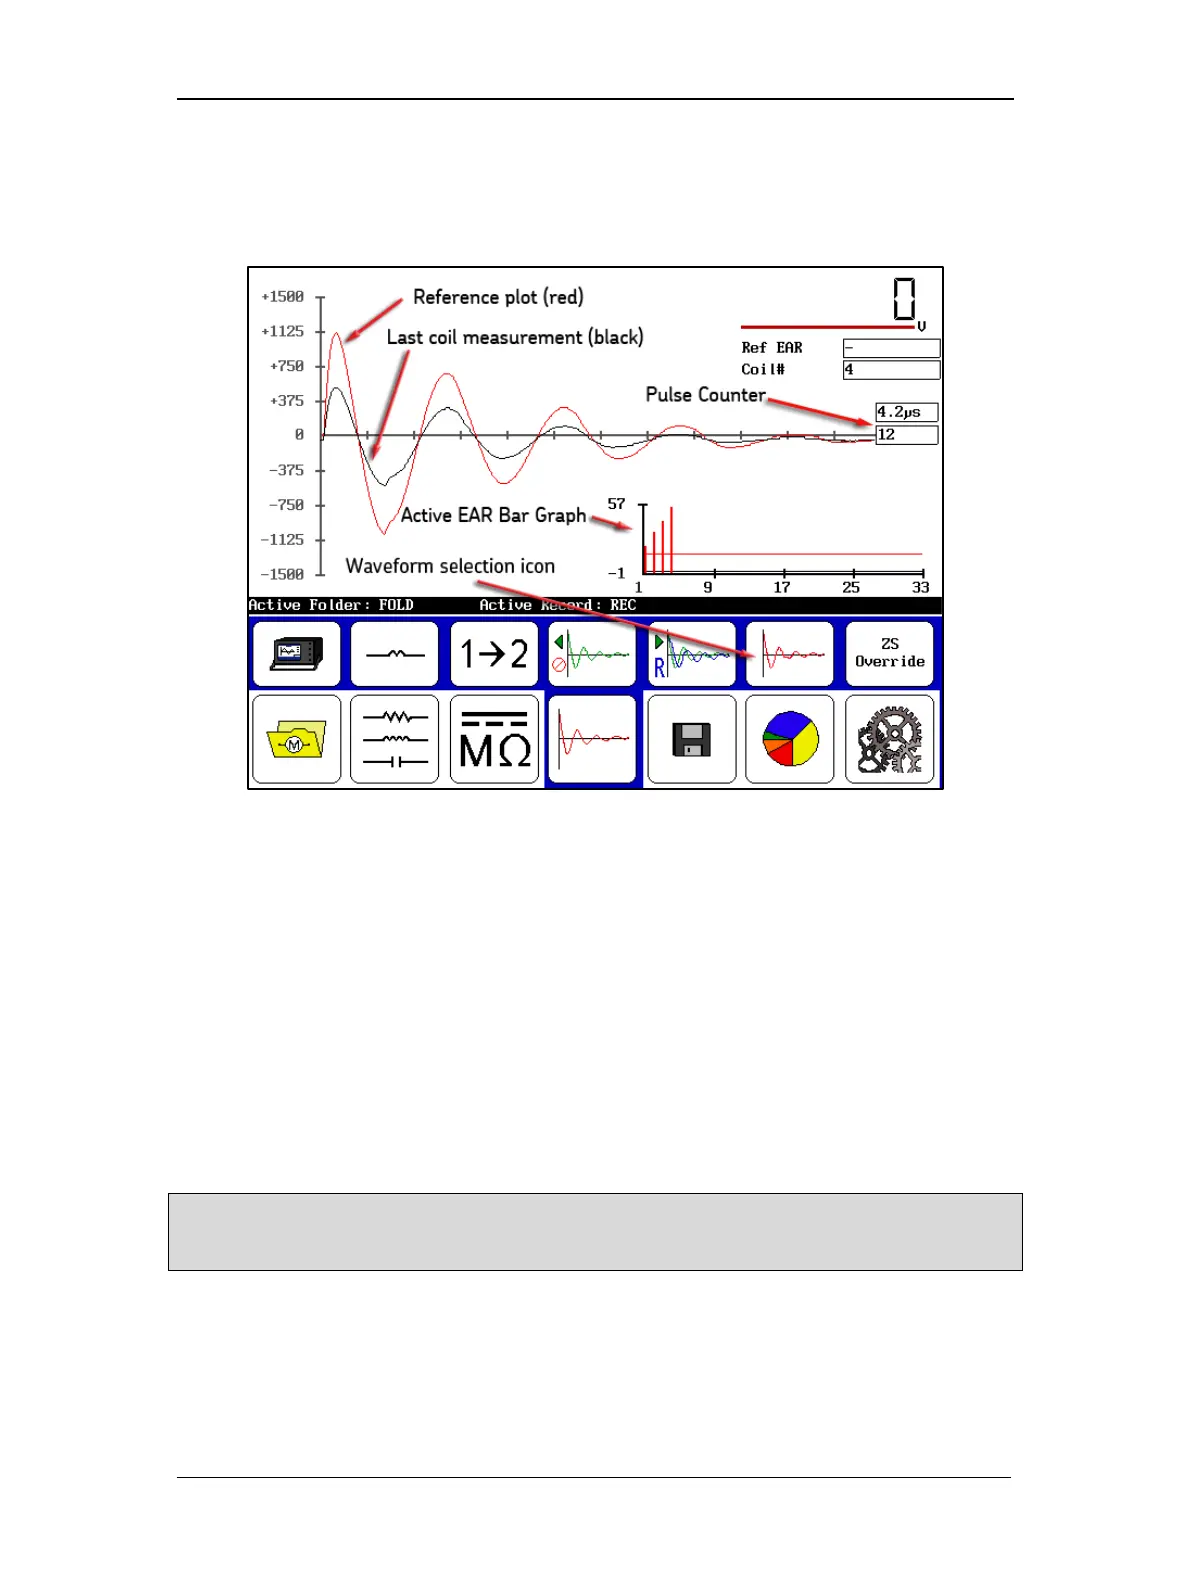
Touch the Waveform Selection icon then the Last Waveform icon to display the results for
the last test as shown below. The reference waveform is shown in red and the current test
waveform is shown in black. (The example image is provided for references only; actual
waveforms may not be as dramatic.)
Figure 114. Single-coil test results screen—Last Waveform selected.
The Ref EAR box displays when and what criteria is exceeded by using red highlighting. The
criteria are set to default values in the user settings, but you can change them as needed.
The Coil# (coil count) box displays the current coil results viewed in the Display Area.
In this chart type, you see only the results from the last coil tested. The reference plot is shown
in red; the coil measurement plot is in black.
The Pulse Counter displays the number of pulses applied at a specific voltage.
The Active EAR Bar Graph shows you a “live view” bar graph of all the EAR values collected
from the first coil (or bar/span) to the current coil. This “live view” shows you where you are in
real time in the coil test. The red horizontal line in the chart is the max limit set for your EAR
measurements. In the example above, we exceed the limit, which is why the bar charts are so far
above the reference line and the Ref EAR field is red.
NOTE: If the EAR Fail Stop option is enabled in the system settings, the test would stop automatically. For
more details on this option and other test settings, refer to the “Using System Settings” section in chapter 4
—for more details.
You should also notice that the Y-axis on the Active EAR Bar Graph has a -1 value at its
bottom. This is so the EAR zero line can be displayed in the graph.