Baker DX User Interface Overview
24 Baker DX 71-030 User Guide EN V10 www.megger.com
Other Interface Display Features
The user interface includes a variety of features that help you navigate the processes more easily.
Some of the more prominent features are shown here.
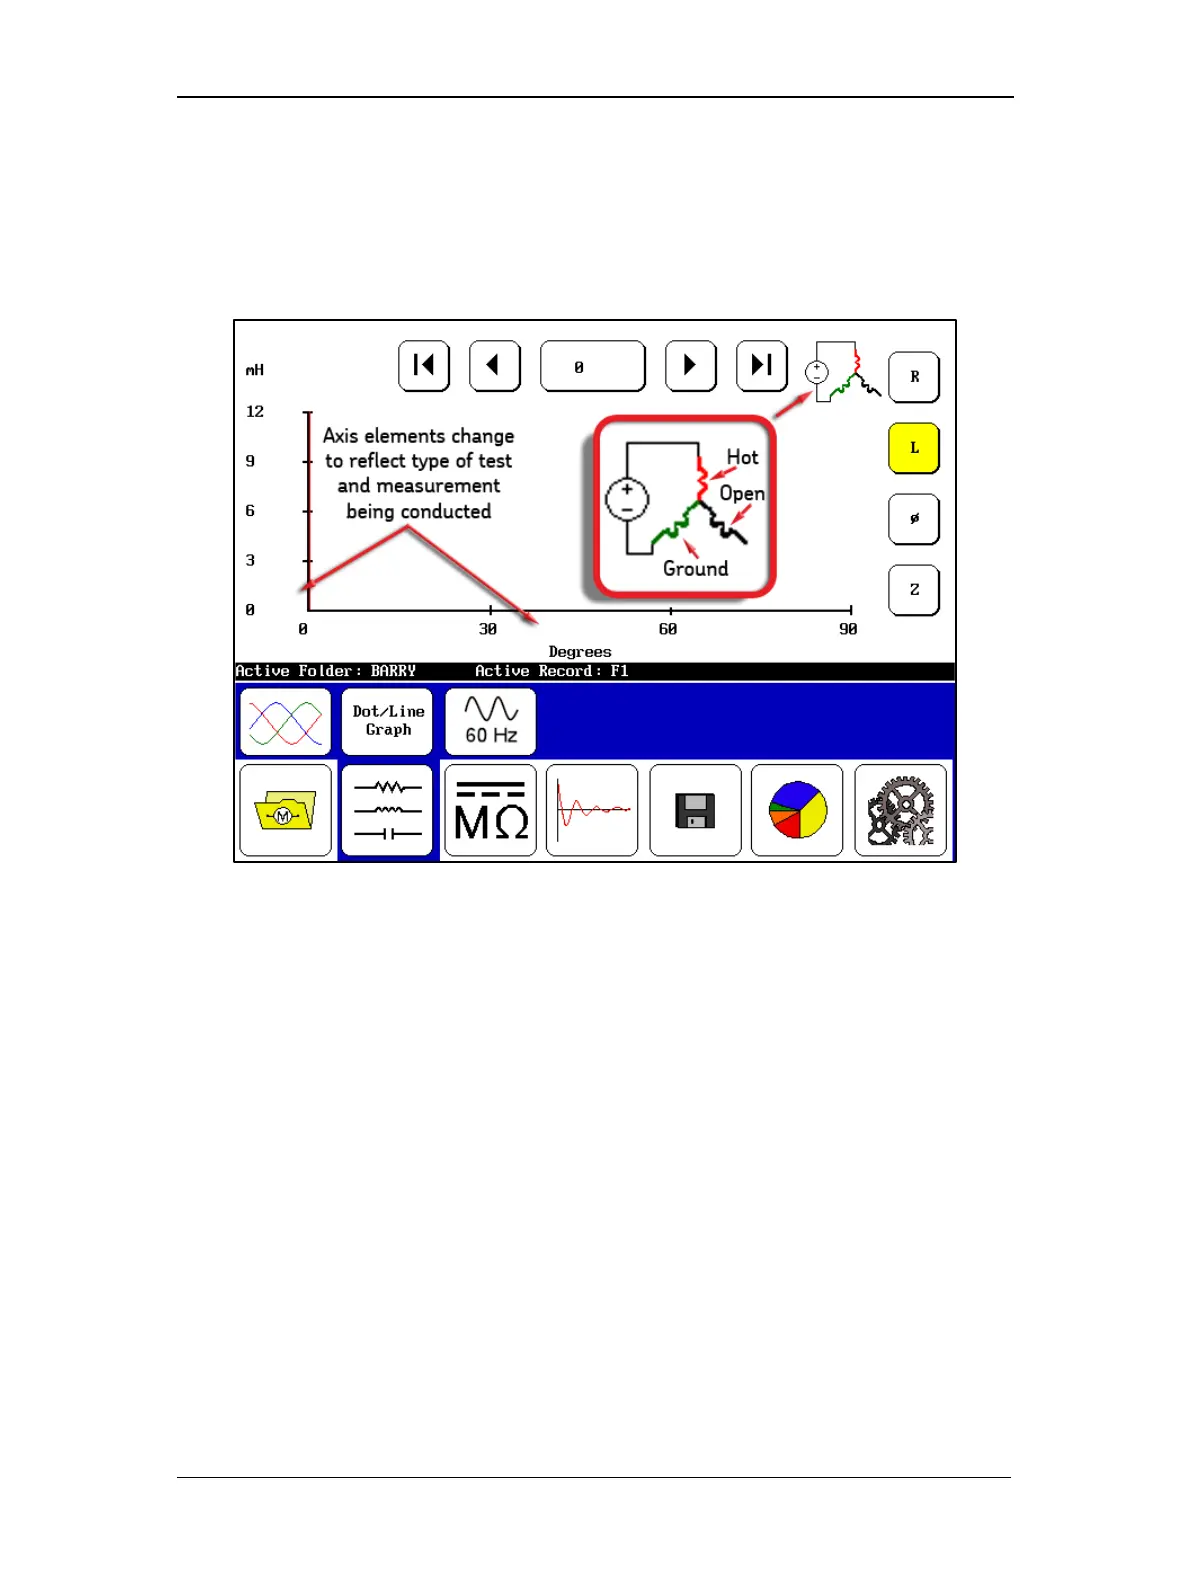
The first example shows that the elements on the X and Y axes change according to the mode
the unit is in and the test type being conducted.
Figure 26. Axis elements change and connection graphic.
In some screens, you will see a graphic that shows you how the unit under test is being
measured. The graphic above shows that the measurements being made are hot, ground, and
open—the typical standard measurement configuration. In others, the connection and
measurements will be hot-ground-ground, and the graphic will reflect that measurement type.