Procedures for Testing with the DX Host
110 Baker DX 71-030 User Guide EN V10 www.megger.com
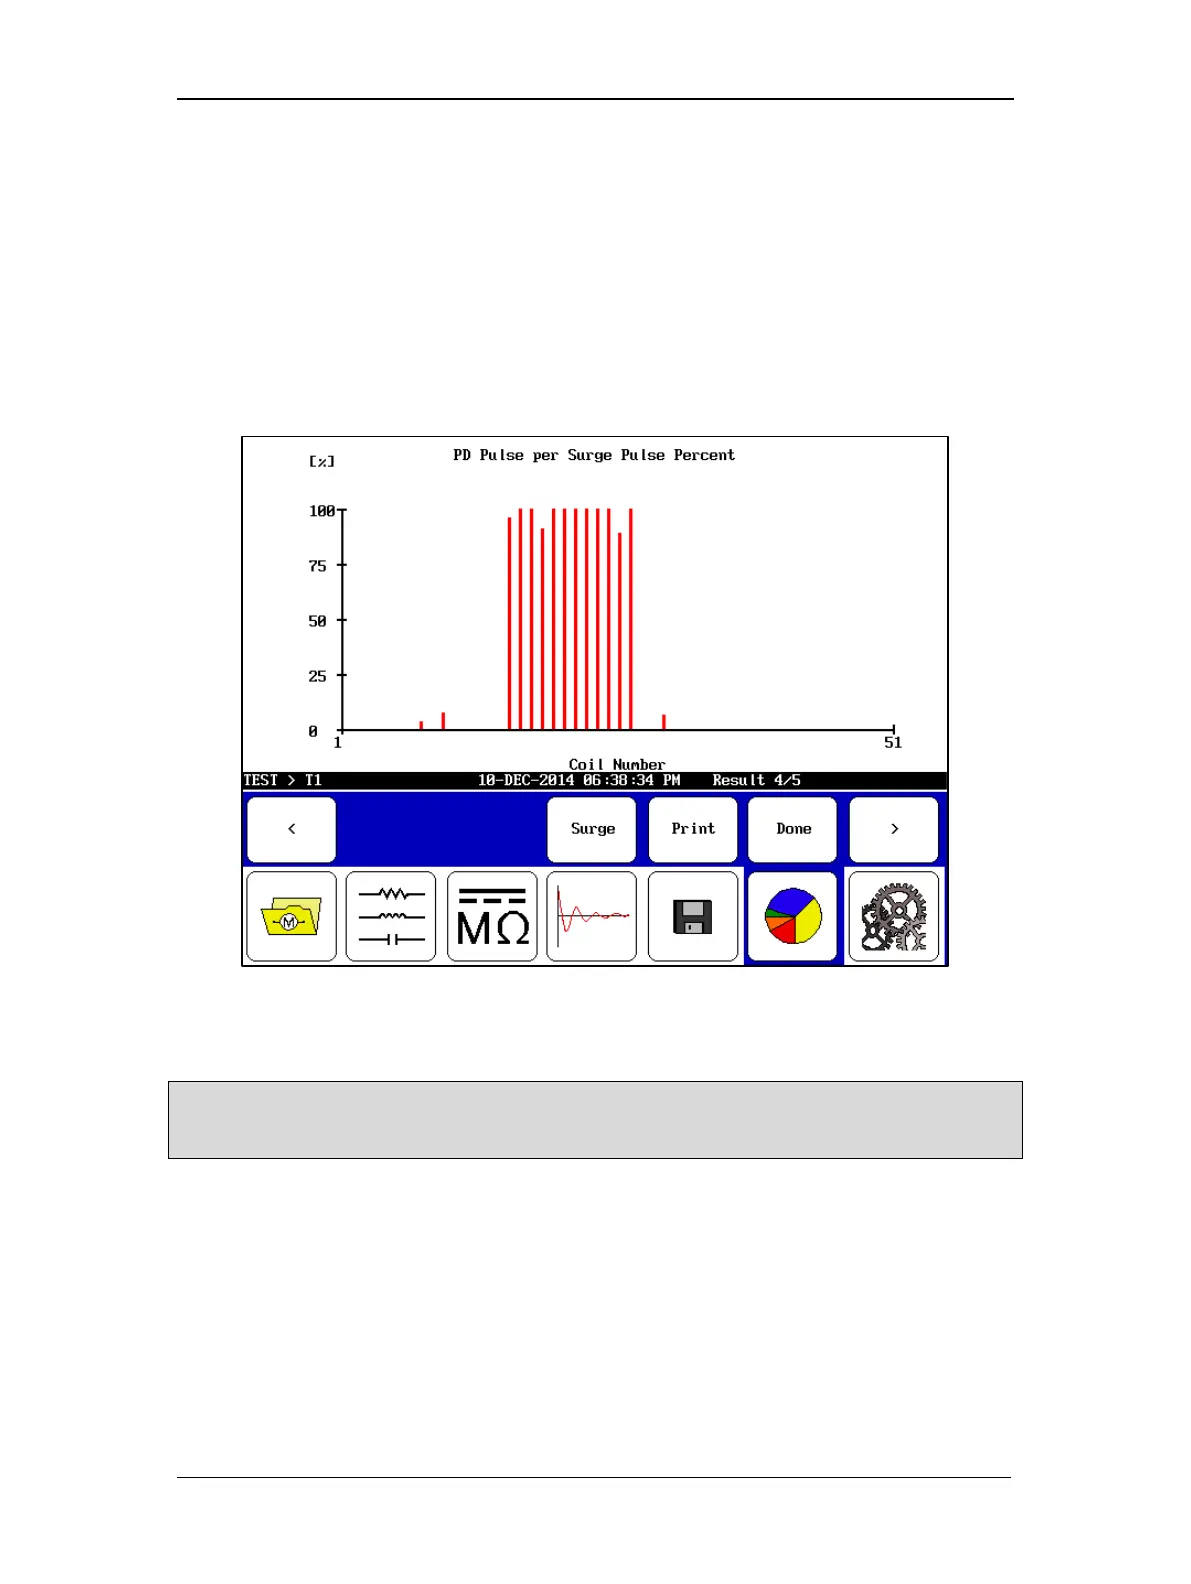
Tap the display screen again to switch between viewing this report and PD Percentage Plot
shown below.
During testing, the software generates multiple surge pulses over the course of a test cycle.
Within each surge pulse, the tester collects the number of PD pulses detected. The PD
Percentage Plot shows the percentage of the total number of surge pulses that had PD pulses
detected within them.
This information can be used to rate coils. Essentially, you can rate coils from 0–100 percent,
with the lower percentage indicating better coils (less PD activity). The ratings can help
determine coil placement in a stator or even indicate bad coils. Higher percentage coils, for
example, might be placed further away from end coils to reduce the stress they are exposed to.
Figure 123. PD percentage plot view—single-coil testing only.
NOTE: If you see a report that shows excessive PD activity and/or activity reaching very high pulse
percentages, you might need to adjust your settings and retest. Such behavior typically indicates that your
PD threshold is set too low or the PD # events level is set too low.


 To Next Page