OPERATION
© 2014 Mold-Masters (2007) Limited. All Rights Reserved.
Revised 1 Oct, 2014
6-14
6.12 Check zone past performance (graph)
Your controller can record and display the temperature history for any
zone over a period of time.
6.12.1 Inspecting the last 5 or 30 minutes
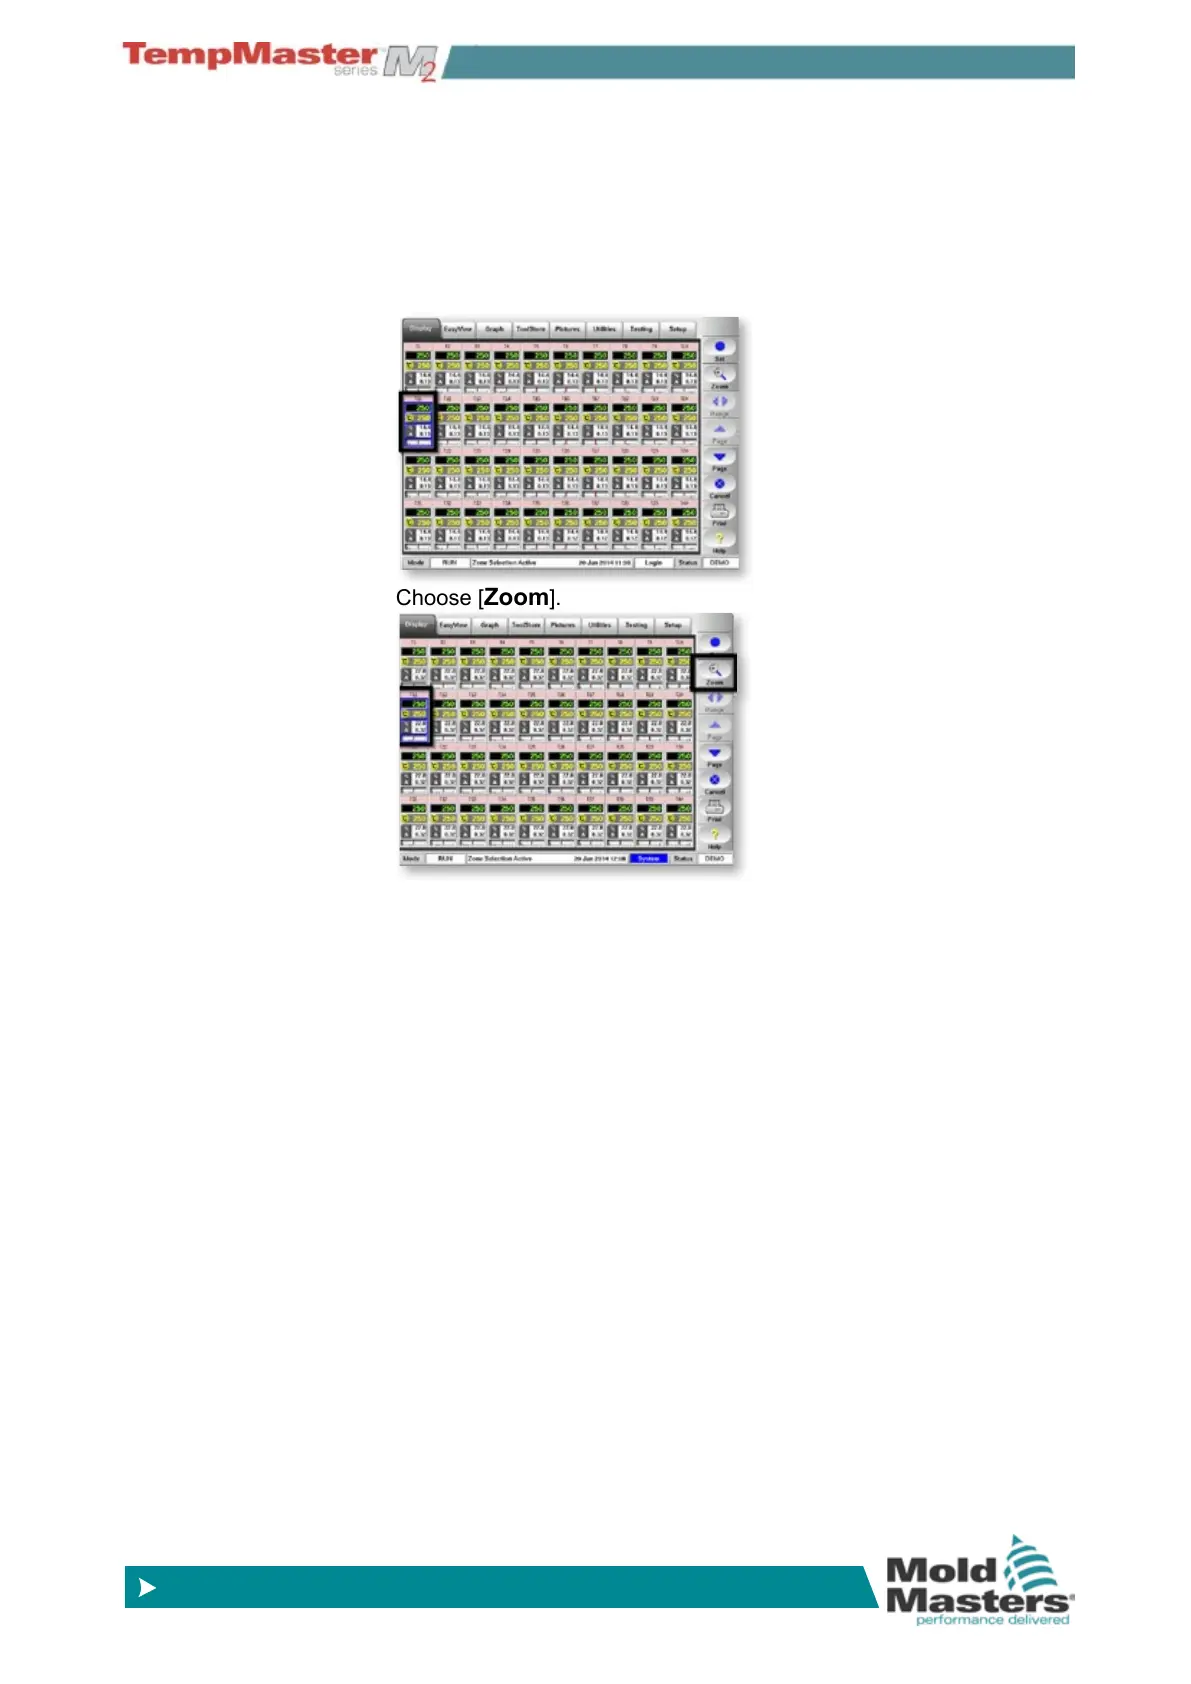
1. Select any zone.
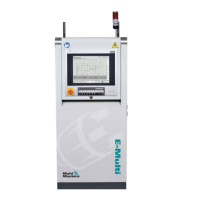
2. Choose [
Zoom].
3. The Zoom page shows
a) The table on the left shows the main settings for the zone and
the current temperature value.
b) The upper graph on the right shows how measured samples
of the actual temperatures have varied above (red) and below
(blue) the set point over a period of time. If the two lines are
running close together, then you have precise temperature
control.
If, however, any zone shows a noticeably wider deviation than
its neighbors, it could indicate potential problems. It could be a
noisy thermocouple input that may be due to poor connections
or a faulty thermocouple.
c) Temperature control could also suffer if you manually select the
wrong speed setting for a zone response rather than using the
automatic choice.
d) The lower of the two graphs shows the output power levels
that have been measured over the same period of time. Power
traces should be fairly similar for similar zones at similar tem-
peratures.
4. Choose [ Scale] to toggle the view from 5 minutes to 30 min-
utes.
5. Choose [p] or [q] to select adjacent zones