176
Rev. 2.0
07/27/2023
MBDV Hardware Manual
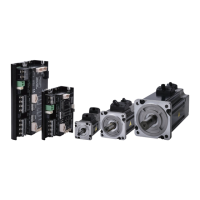
Step 3
• Click the " Start Analysis " button, the servo system starts the speed closed-loop analysis, and
the curve of the result is displayed.
• Click the icon in the upper right corner of the graph area to optimize the display curve.
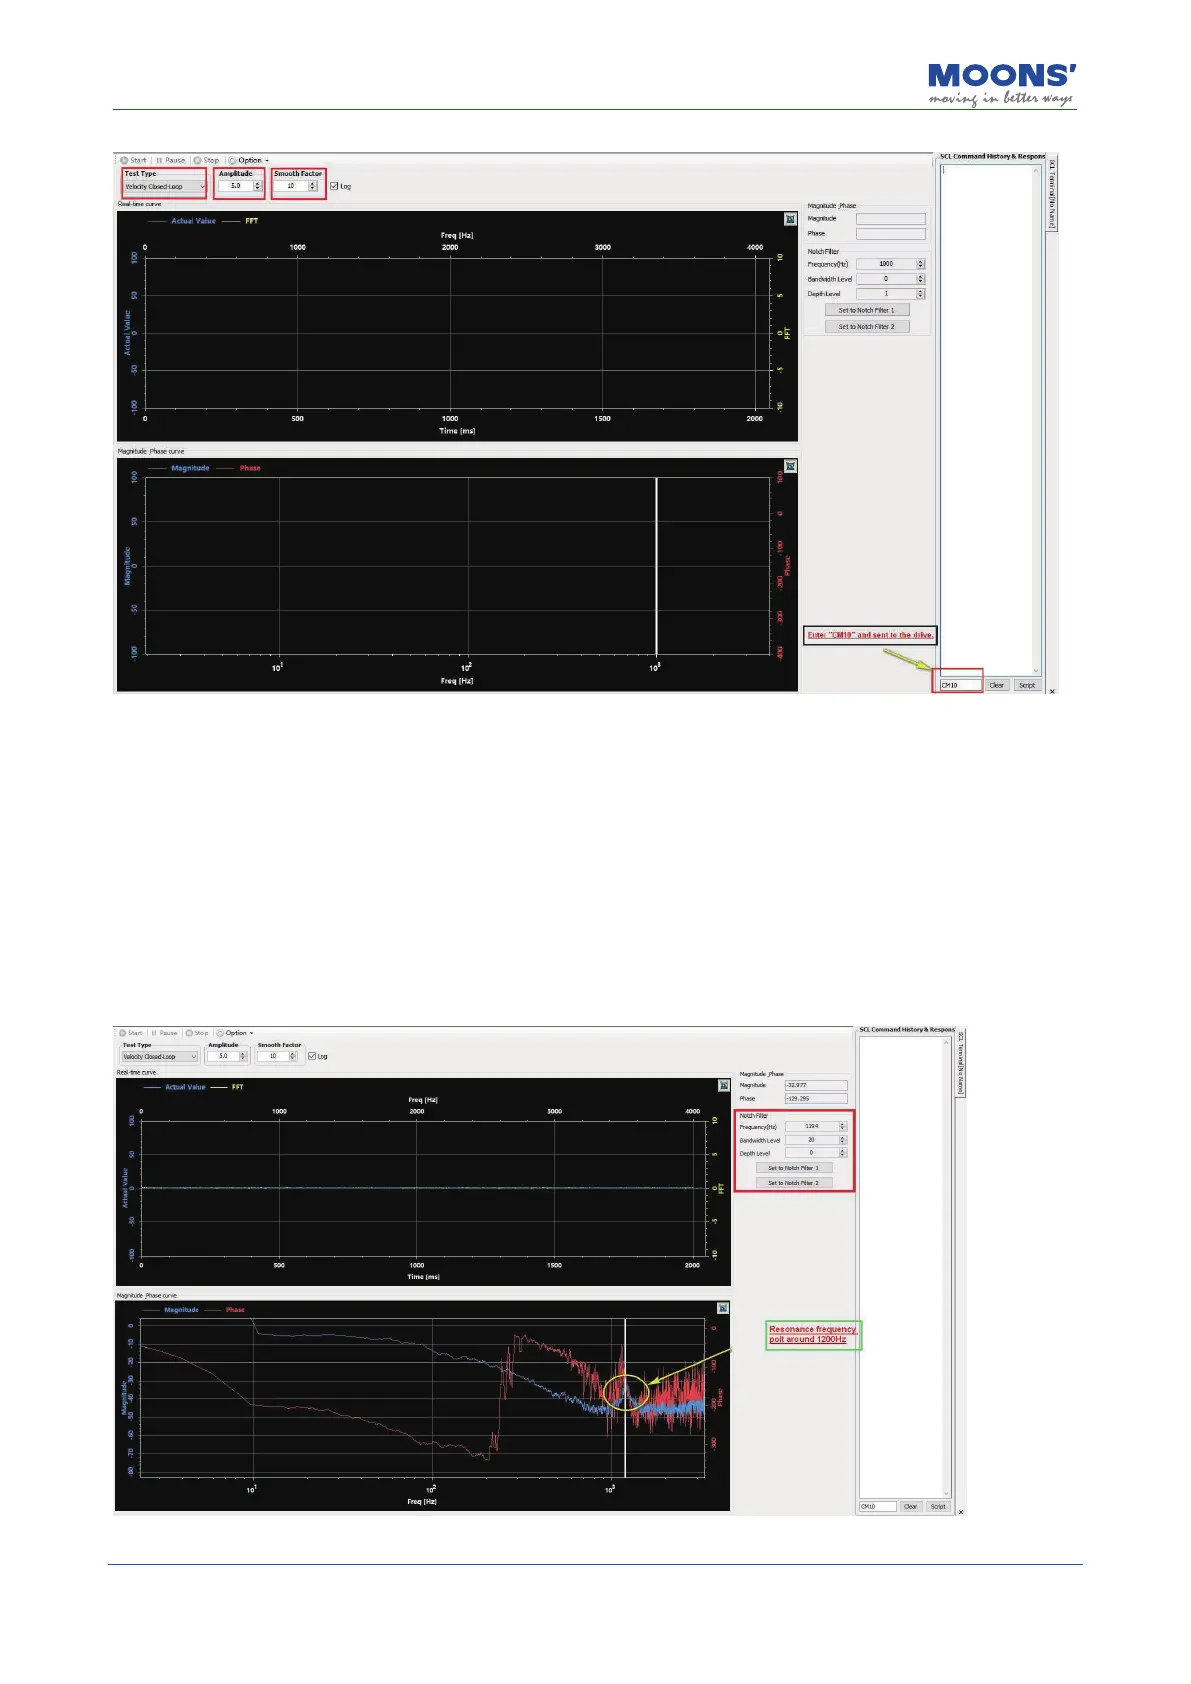
• Move the reference line in " Amplitude and Phase Curve " to the place where the amplitude
curve (blue curve in the gure below) has abnormal protrusions
The following gure shows obvious vibration at 1200Hz. Click " Set as the rst group of resonance
suppression lters " or " Set as the second group of resonance suppression lters " to set the
resonance frequency as the resonance suppression lter 1 or the resonance suppression lter 2.