Section 2 NS Series Functions 2-15 Data Logs
2-337
NS Series Programming Manual
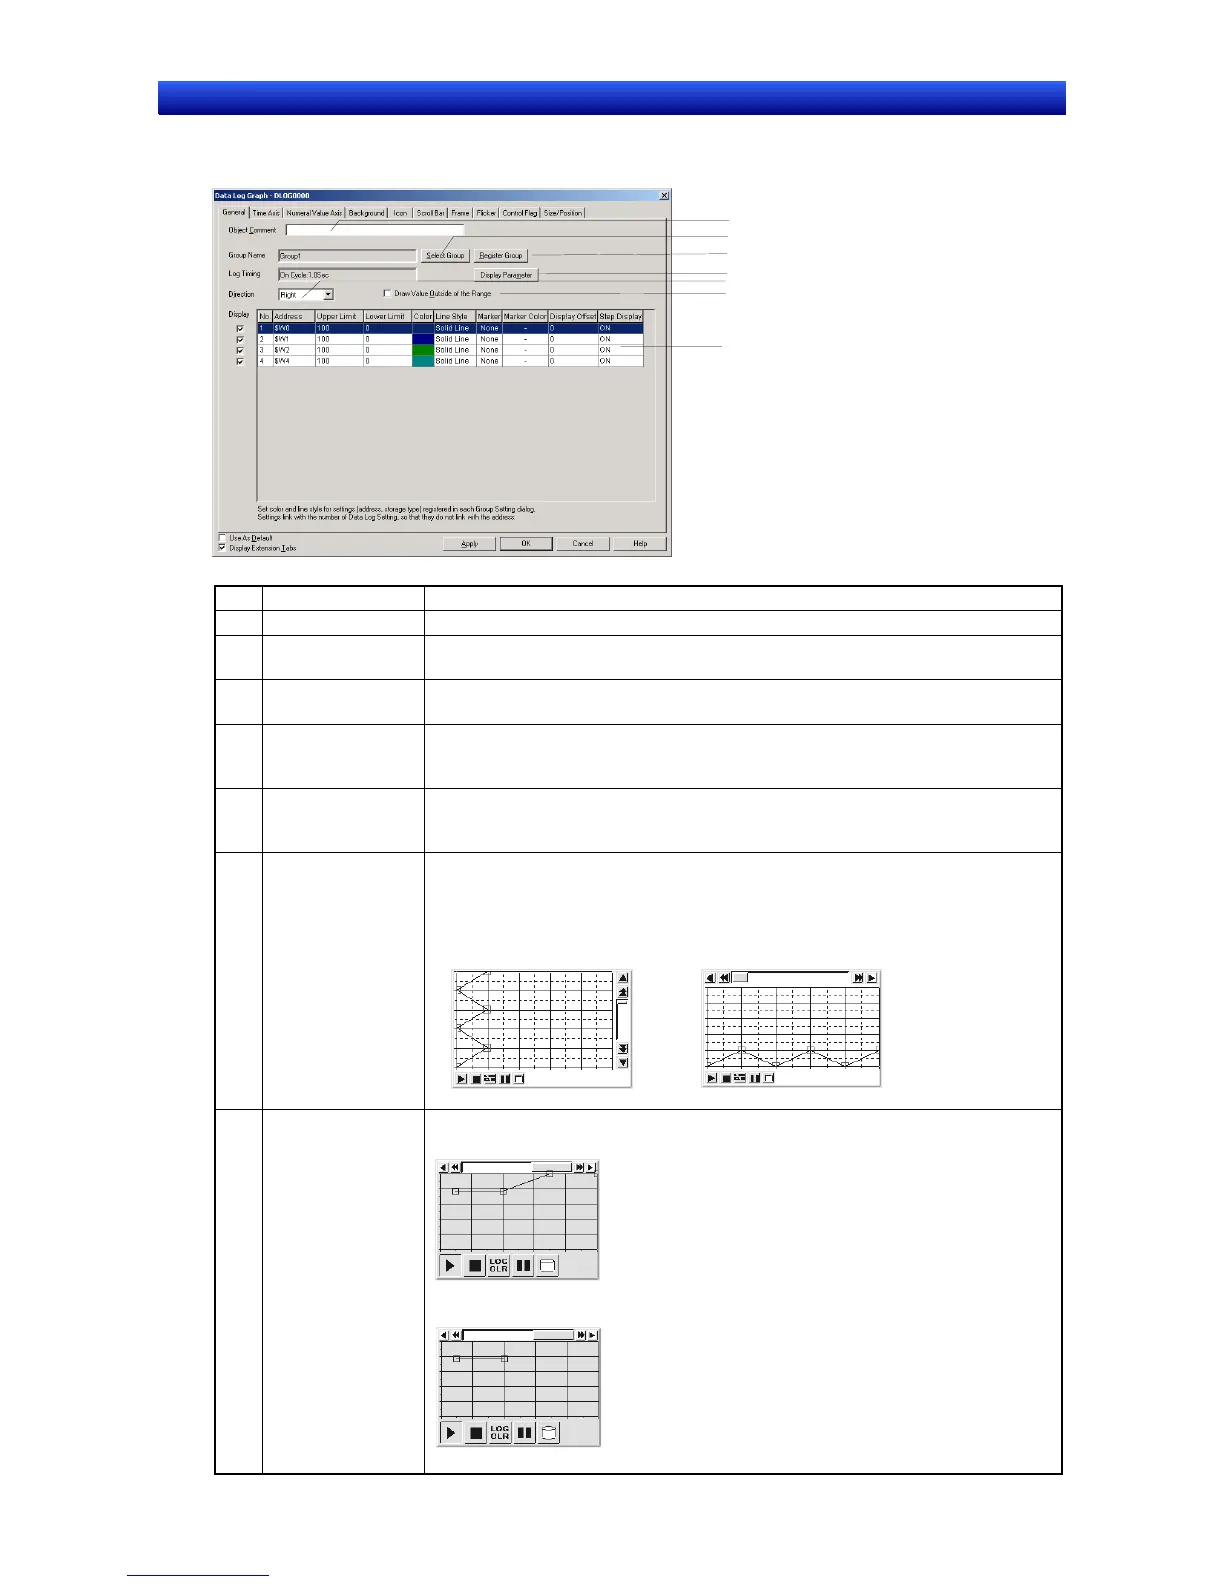
General Tab Page
Sets the data log group and address to be displayed.
1
2
3
4
6
7
5
No. Setting Details
1 Object Comment Sets an explanatory comment for the pasted object (up to 32 characters).
2 Select Group
Click the Select Group Button to display the Select Group Dialog Box. Selects the
group for group display.
3 Register Group
Click the Register Group Button to display the Data Log Setting Dialog Box. Use
this button to add, edit, or delete data log groups.
4 Display parameter
Select the data log address from the list of addresses and click the Display Pa-
rameter Button to display the Display Parameter Setting Dialog Box. Sets the line
type and markers.
5 Data log address
list
Displays the registered addresses for the selected data log groups. Deselect ad-
dresses that are not to be displayed on the graph. Remove the tick to the left of the
address to deselect it.
6 Direction Select one of the following four display directions.
From Up, Down, Right, or Left
The time and numeric value axes will depend on the display direction, as shown in
the following diagram.
Up or Down Right or Left
Time axis
Time axis
Numeric value axis
Numeric value axis
7 Draw Value Out-
side of the Range
If the Draw Value Outside of the Range Option is selected, the positions of the
maximum and minimum values outside of the range will be displayed.
If the Draw Value Outside of the Range Option is not selected, the values outside
of the range will not be displayed.

 Loading...