Section 3 Using PTs 3-5 Displaying Graphs
3-15
NS Series Programming Manual
3-5 Displaying Graphs
This section describes how to change displayed graphs. Data log graphs will be used as an example.
3-5-1 Changing Graph Displays
Graph display can be changed using the following methods.
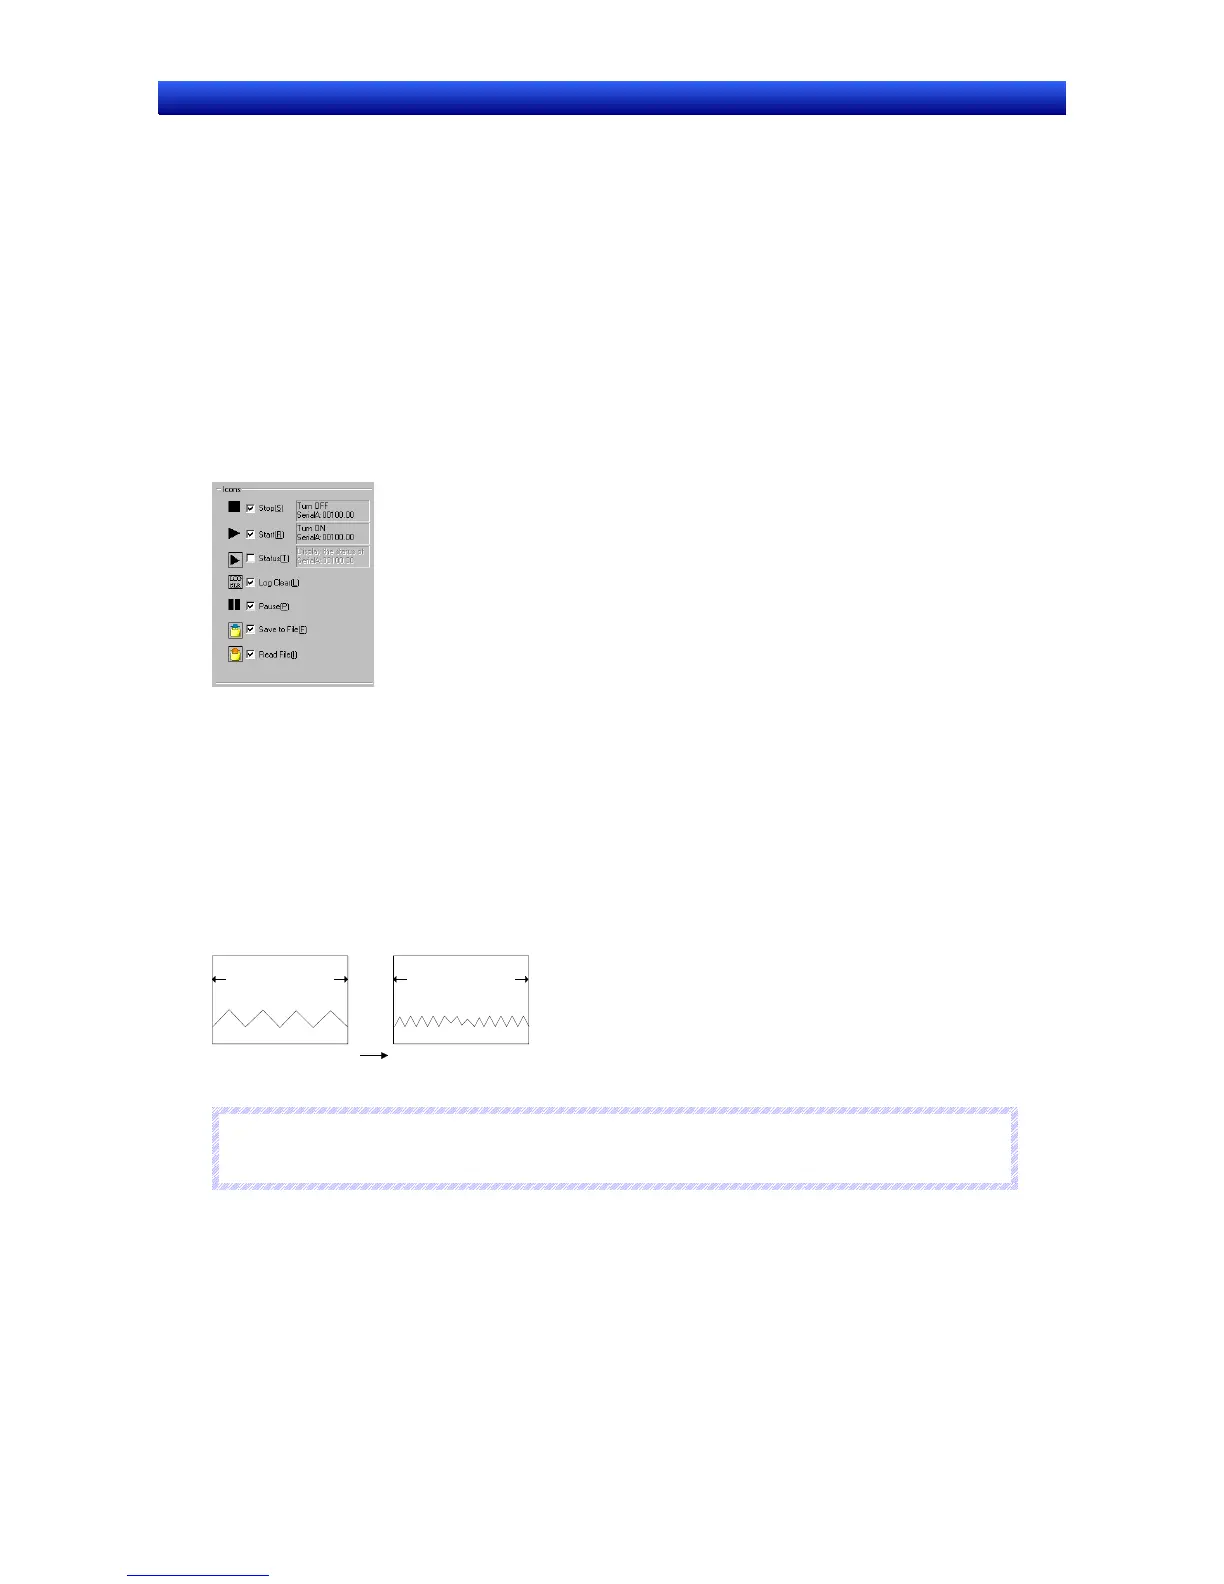
• Using icons.
• Using address for updating display.
Refreshing Display Using Icons
Special icons can be added to graphs.
1. Make the data log settings when creating a screen using CX-Designer and create a data log graph. A
special icon will be added to the data log graph.
2. The data log graph display will change during operation based on the functions of the icon pressed.
Multifunction Object Data Log Control can execute the same functions as icons.
Changing Display Using Addresses for Updating Display
Refreshing of data log graph display can be controlled by the contents of specified addresses.
Changing Time Axis Scales
The graph can be displayed using a different specified time scale.
1. Select Scale for Time Axis - Indirect under the data log graph property setting and specify the ad-
dress that will specify the scale. The scale displayed on the graph will change based on the con-
tents of the specified address.
10-second display
20-second dis

 Loading...