Examining CCSv5
Debugging
Once again, the “debug” side of the Code Composer Studio lets you download your executable
output (.out) file onto your target processor (i.e. MSP430 device on your Launchpad) and then run
your code using various debugging tools: breakpoint, single-step, view memory and registers, etc.
You will get a lot more detail and experience with debugging projects when running the upcoming
lab exercises on your Launchpad.
Target Config & Emulation
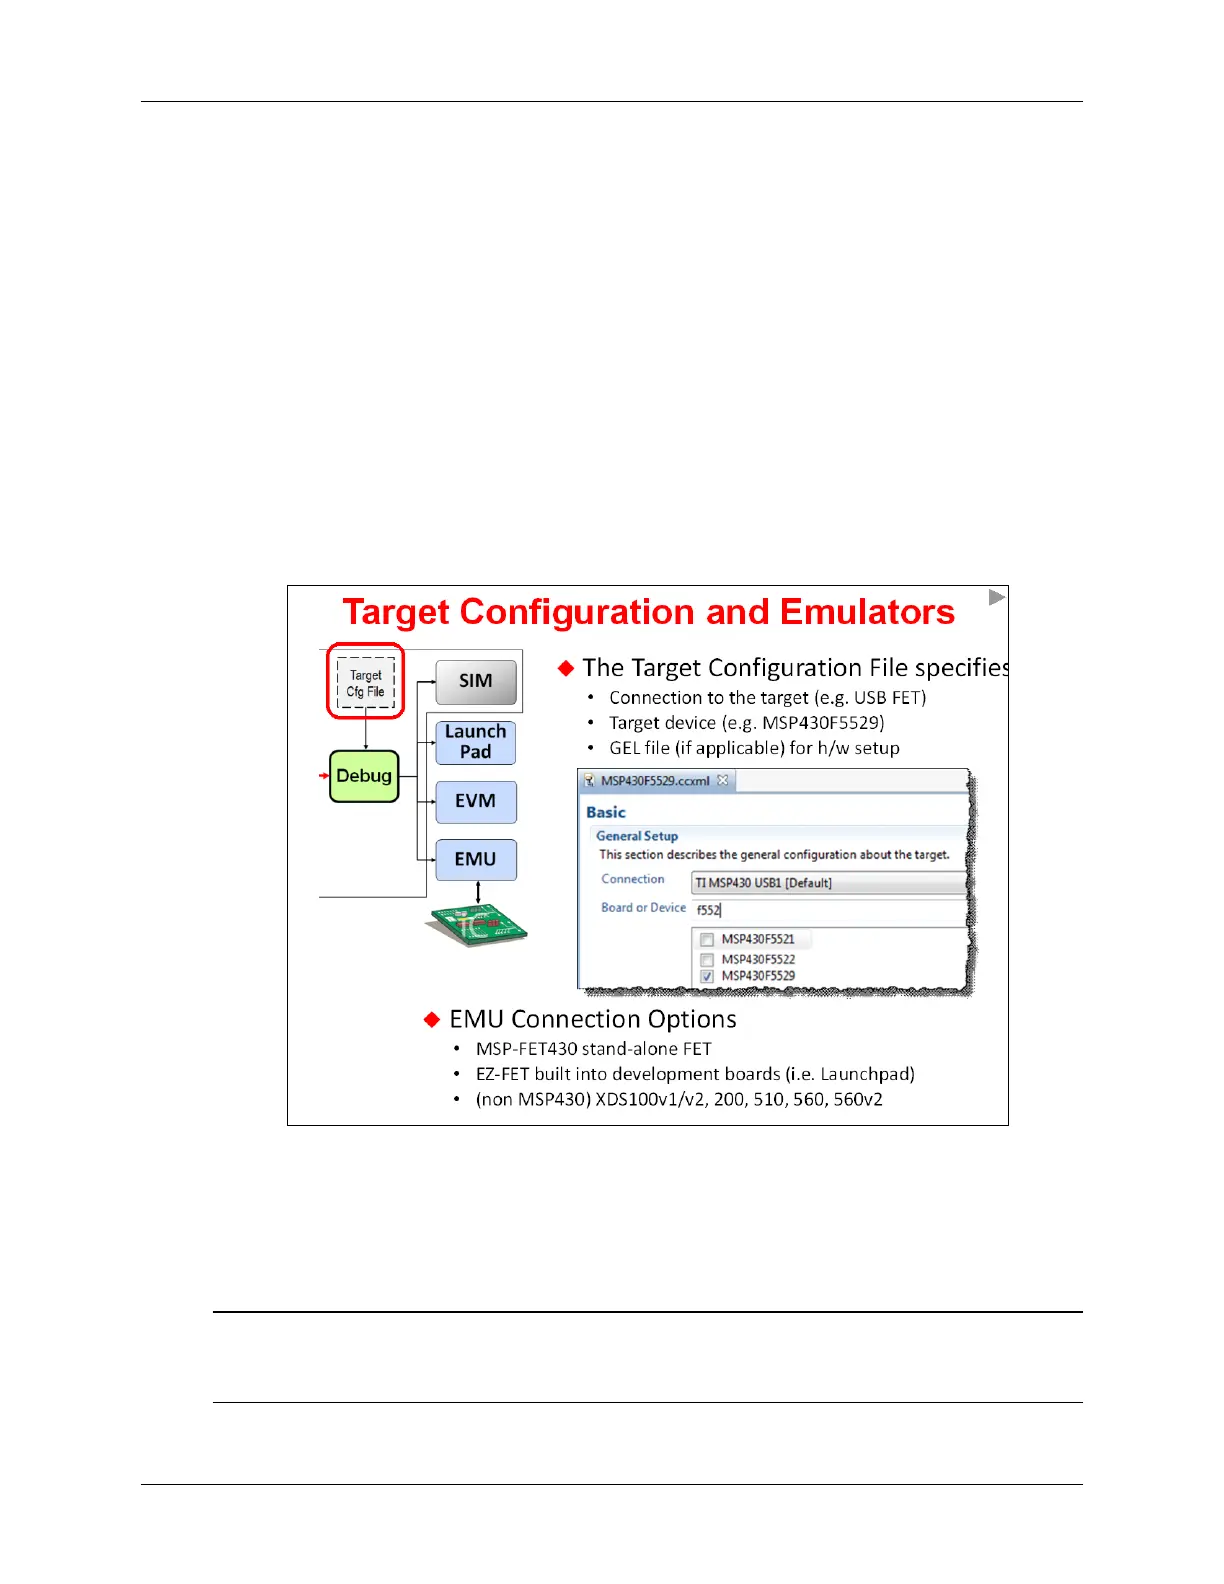
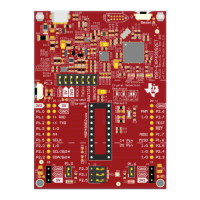
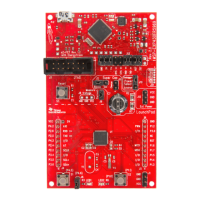
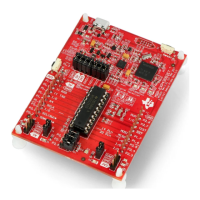
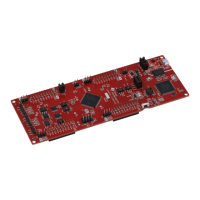
CCS needs to understand how to connect to your target. That is, which target processor do you
want to download-to and run your code on?
Going back to older revisions of CCS (versions prior to CCSv4), TI provided a stand-alone tool
where you would specify how the target board was connected to CCS. Nowadays, this feature
has been integrated into CCS. The Target Configuration File (.ccxml) contains all the information
CCS needs to connect and talk to your target (be it a board or a software simulator).
For the MSP430, the CCXML file is automatically created when you create a new project. This file
is based on your telling CCS which CPU variant you’ve chosen (i.e. MSP430F5529); as well as
which “Connection” you are planning to use for connecting your PC to the target board.
The most common connection that MSP430 users choose is: TI MSP430 USB1 [Default]
In fact, this is the connection we’ll be using in the upcoming lab exercises.
Note: If you ever get an error that indicates CCS doesn’t know how to connect to the target, you
probably didn’t specify the “connection” when creating your project. You can easily fix this
by editing the project’s properties.
2 - 12 MSP430 Workshop - Programming C with CCS
 Loading...