Sequence Graphing 372
3. On the Window Editor (8$), set the Window variables.
5. On the Y= Editor, set
Axes = CUSTOM, XAxis=u1, and YAxis=u2.
6. On the Window Editor (8$), set the Window variables.
nmin=0
nmax=400
plotstrt=1
plotstep=1
xmin=0
xmax=400
xscl=100
ymin=0
ymax=300
yscl=100
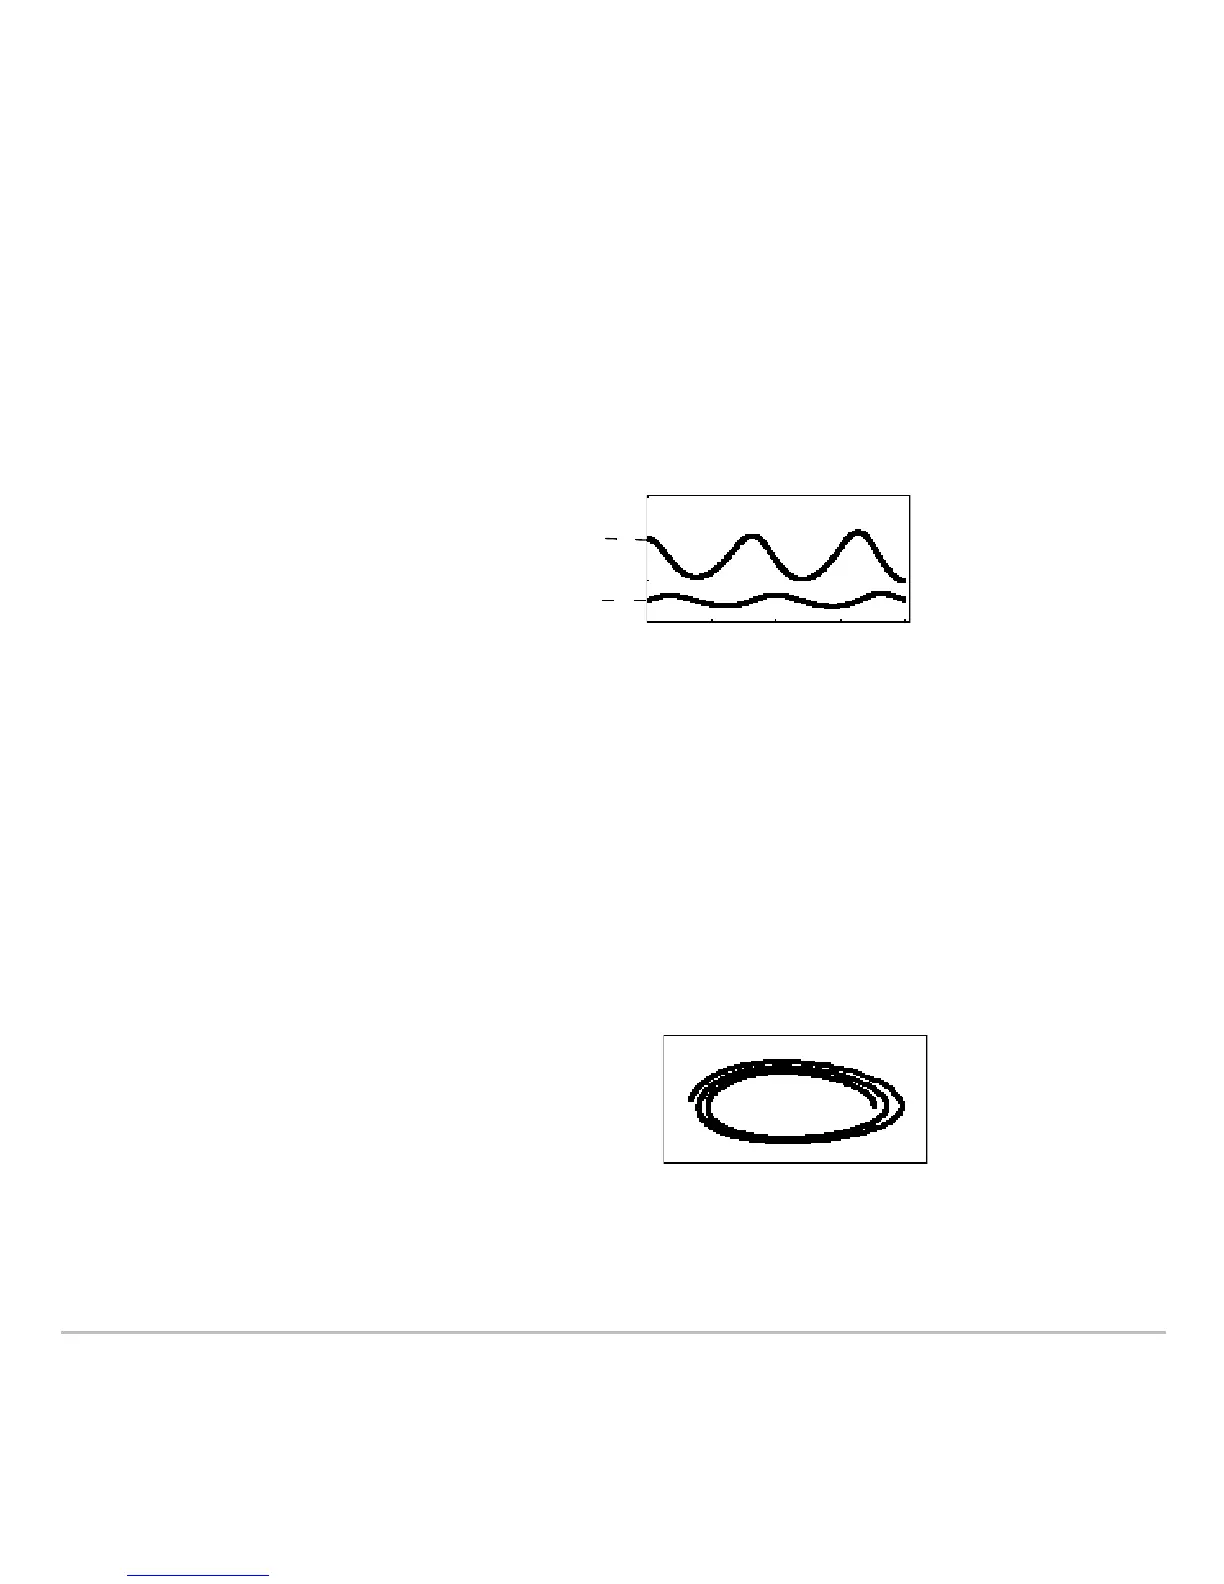
4. Graph the sequence
(8%).
Note: Use … to individually
trace the number of rabbits
u1(n) and foxes u2(n) over time
(n).
nmin=0
nmax=400
plotstrt=1
plotstep=1
xmin=84
xmax=237
xscl=50
ymin=25
ymax=75
yscl=10
7. Regraph the sequence.
Note: Use … to trace both the number of
rabbits (xc) and foxes (yc) over the cycle
of 400 generations.
u(n)
u1(n)
u2(n)
u2(n)
u1(n)
 Loading...


