Chapter 3 ’Web Browser Interface’ — Interface Description
170 Amethyst III DTV Smart Switch
User Manual
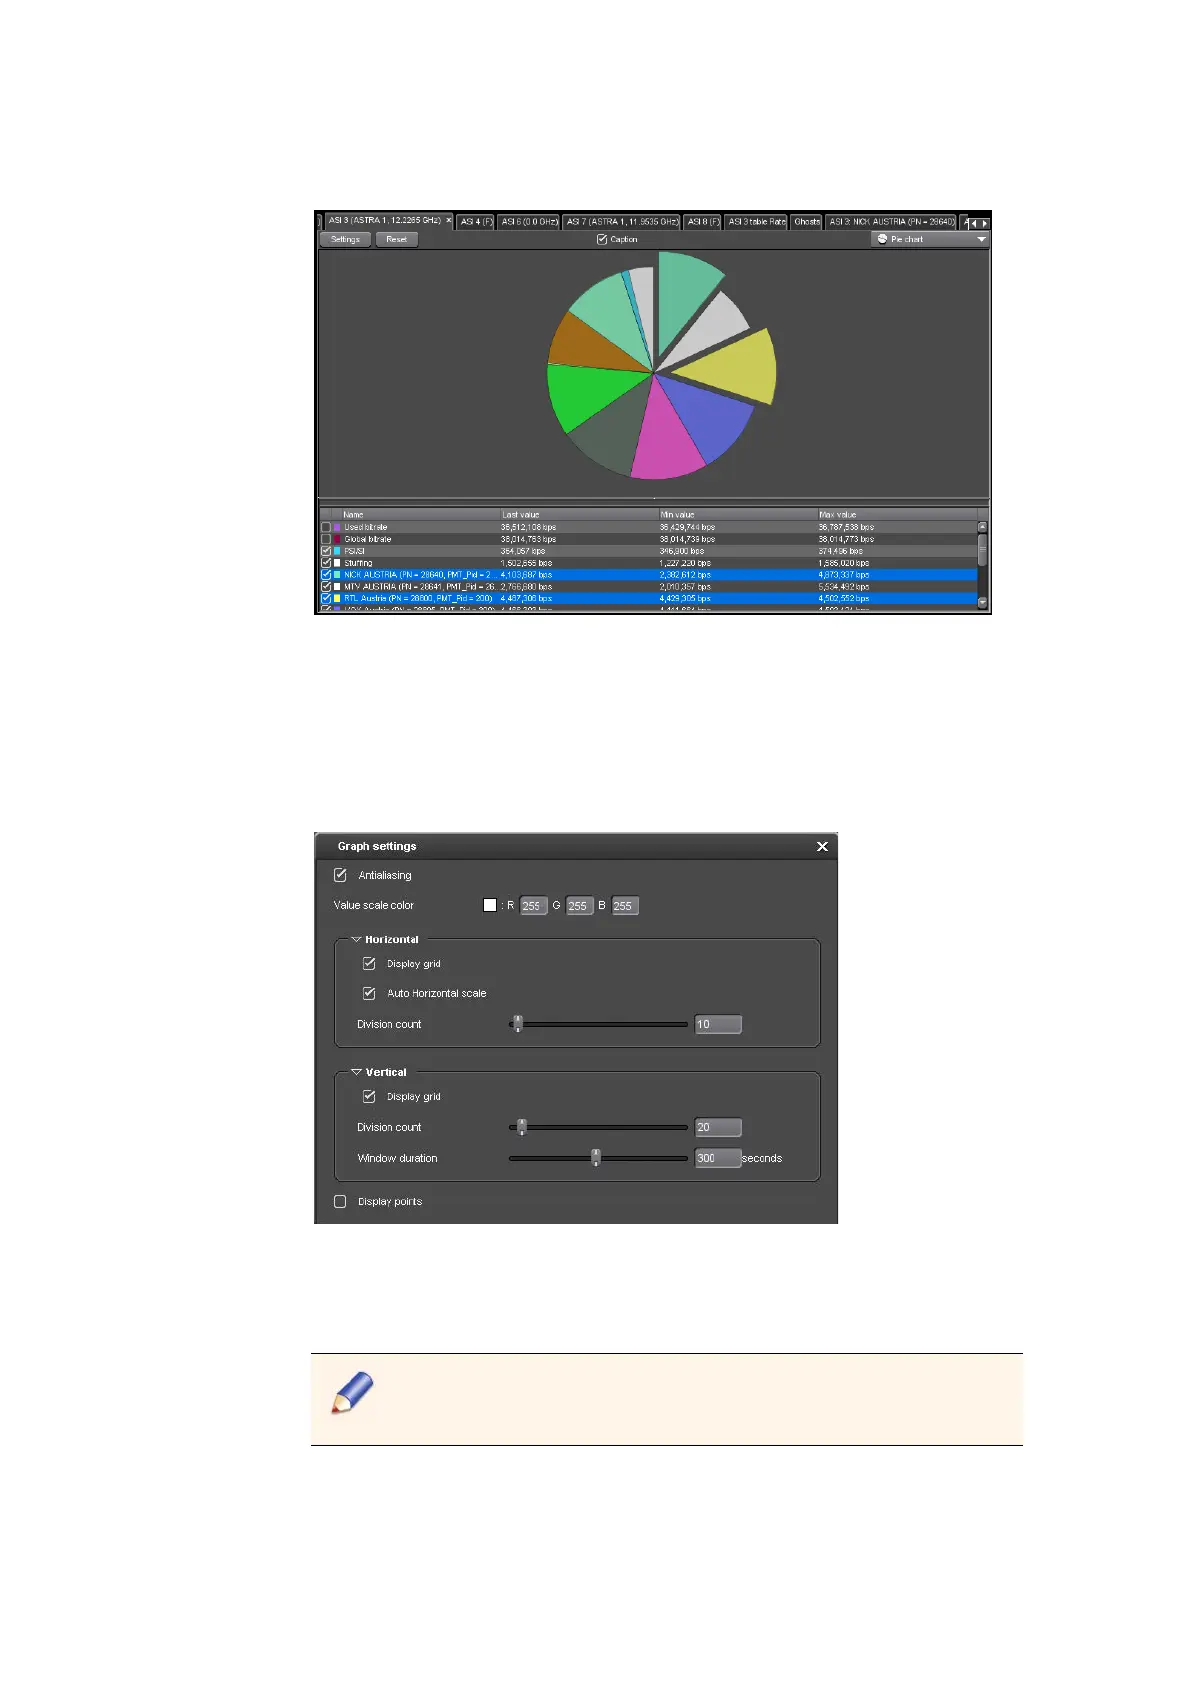
Figure 3-101. PIDs selected on a pie chart
Graph Settings
On the top-left corner of the Statistics view, a Settings button lets you
access the Graph settings dialog.
Figure 3-102. Graph settings (for a stacking area chart).
Available settings depend on the type of chart. You may set the following
items:
Antialiasing: check the box to smooth the curves on graphs.
The CPU usage of the supervision PC is more important when the
antialiasing option is enabled.
 Loading...