5 Using E9300 E-Series Power Sensors
158 N1911A/1912A P-Series Power Meters User’s Guide
CDMA Signal Measurements
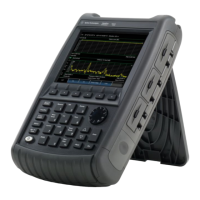
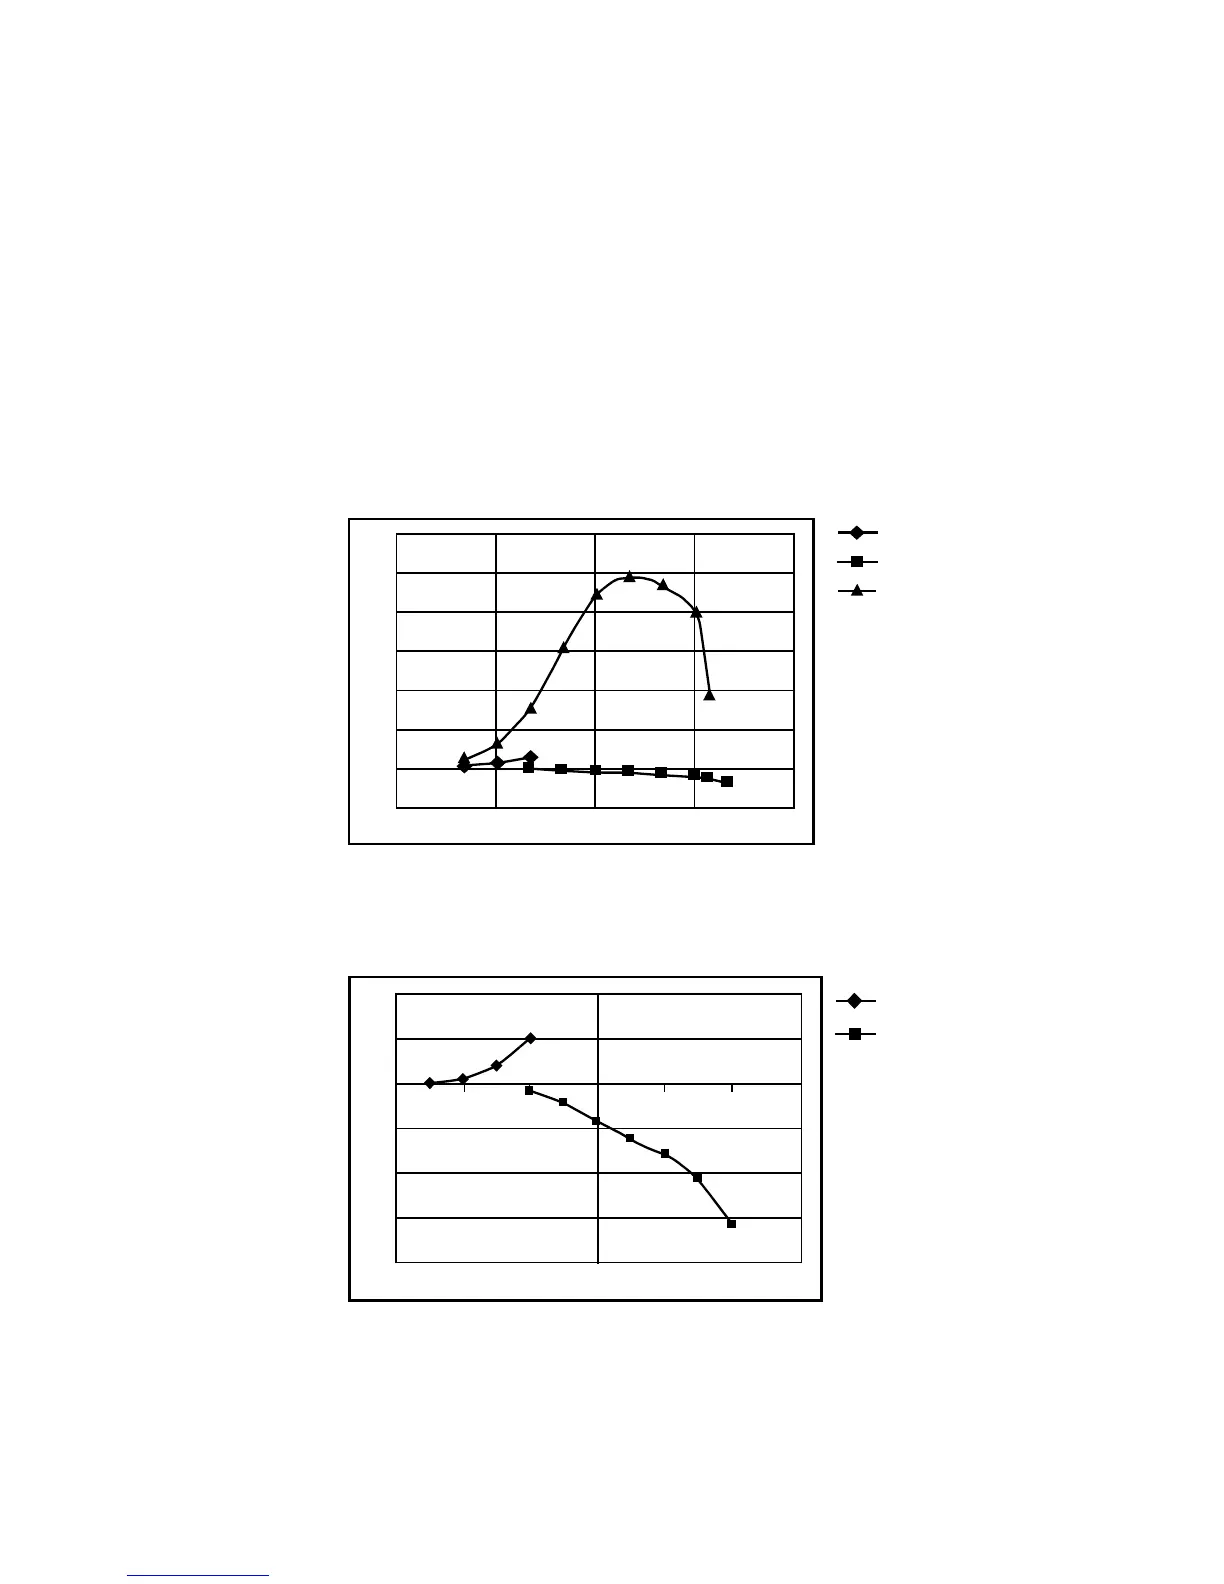
Figure 5- 117 and Figure 5- 118 show typical results obtained when
measuring a CDMA signal. In these examples, the error is determined by
measuring the source at the amplitude of interest, with and without
CDMA modulation, adding attenuation until the difference between the
two values stops changing. The CW sensor in Figure 5- 117 uses correction
factors to correct for power levels beyond its square law operating region.
Figure 5-117Wideband CDMA error of E-Series E9300 power sensor versus corrected CW
sensor.
Figure 5-118CDMA (IS-95A): 9Ch Fwd
1.2
1
0.8
0.6
0.4
-30 -20 -10 0 10
20
30
0.2
0
0.2
Power (dBm)
Error (dB)
Lower Range Error
Upper Range Error
CW Sensor Error
0.1
0.05
0
-0.05
-30
-20
-10
0
10
20
30
-0.1
-0.15
-0.2
Power (dBm)
Modulation Error (dB)
Lower Range Error
(E9300 E-Series power
sensor only shown)
Upper Range Error
 Loading...