Introduction 1
N1911A/1912A P-Series Power Meters User’s Guide 15
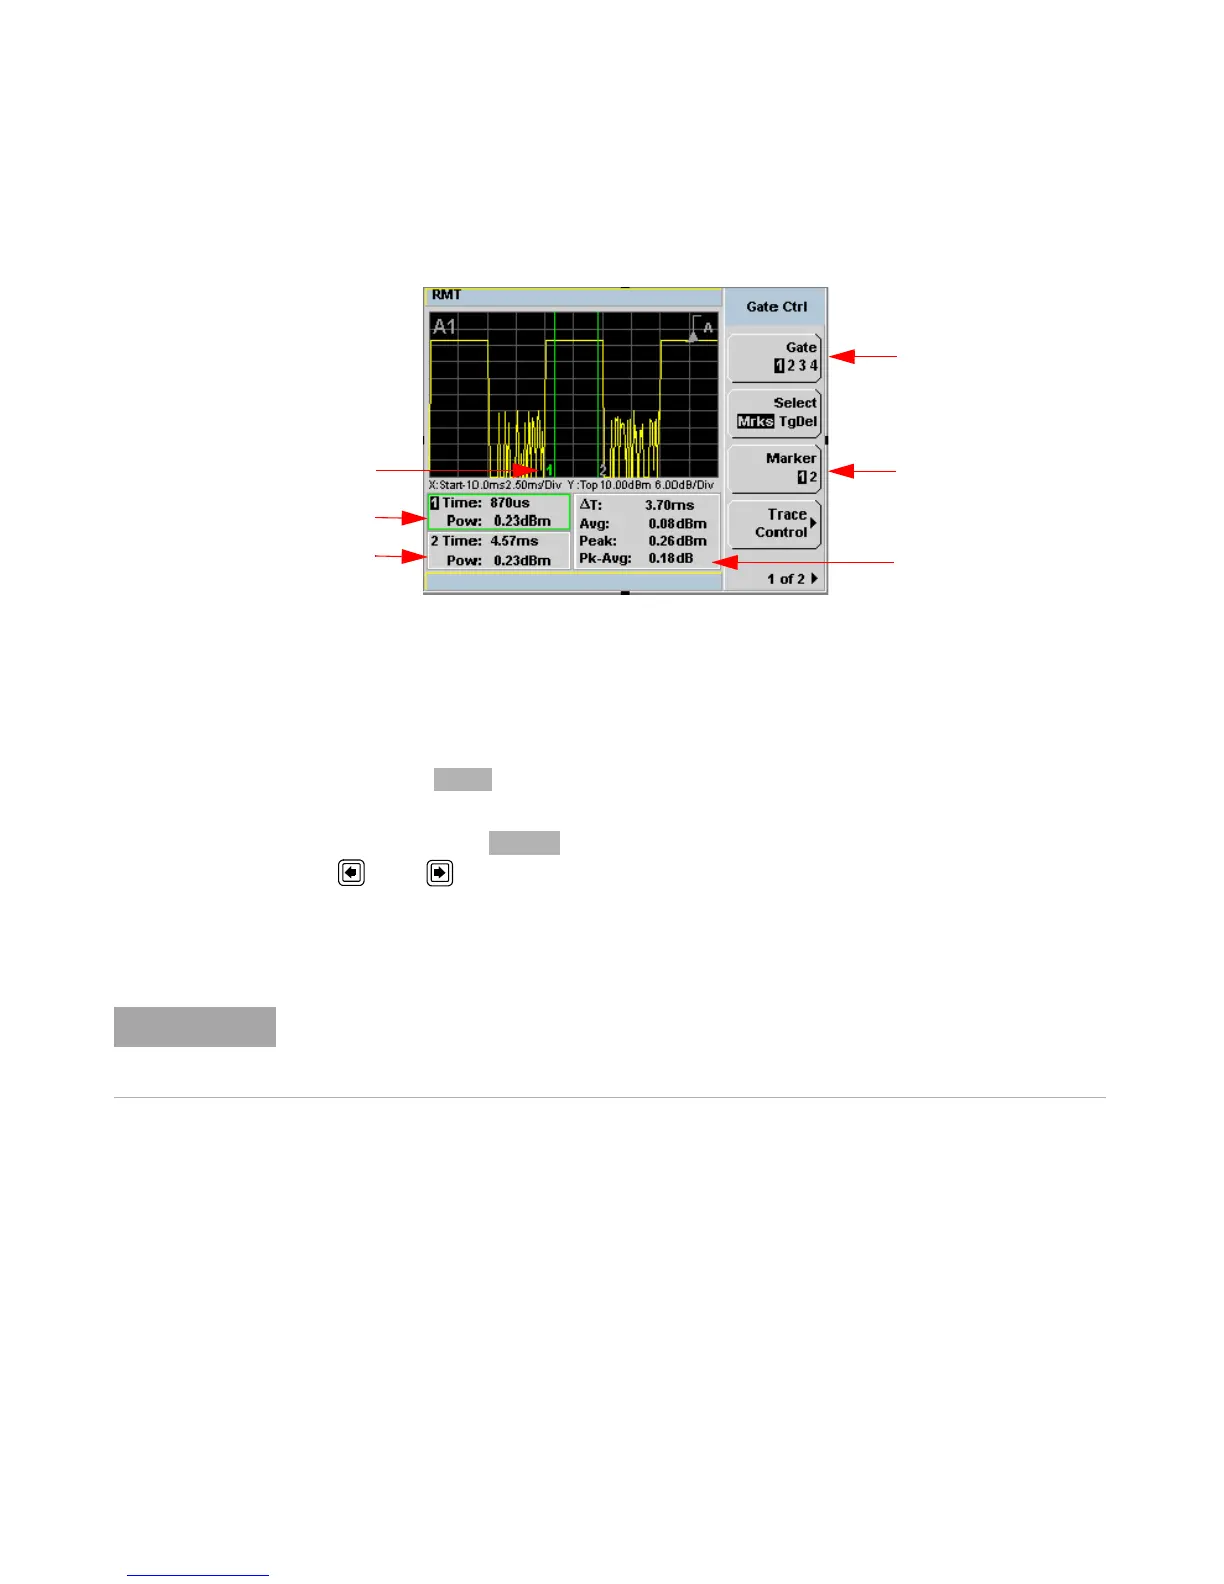
Figure 1-5 Trace display in single enlarged window in markers mode
Figure 1- 5 shows a single enlarged window with the Gate Ctrl menu and
associated tables and markers. The Gate Control is the default display
when using trace display.
24 Pressing scrolls through the 4 gates available for each channel.
25 The markers, 1 and 2, indicate the start and end points of the selected
gate. Pressing toggles between the two markers. You can use the
and keys to move the active marker along the trace.
26 The highlighted table, with the green border, shows the time (Time:) and
the instantaneous power level (Pow:) of the active marker at the
configured point. A negative time value indicates a measurement before
the trigger point.
27 This table shows the time (Time:) and the instantaneous power level
(Pow:) of the inactive marker at the configured point.
28 The highlighted marker shows the active marker at the configured point.
29 This table shows the width of the gate
ΔT: (time between the markers),
the average, peak, and peak- to- average ratio power measurements
within the active gate.
Gate timing parameters are all related to your chosen trigger point. This may be different
from the timing of the triggering event if you have configured a trigger delay. Refer to item
No 30 for more information.

 Loading...