Introduction 1
N1911A/1912A P-Series Power Meters User’s Guide 17
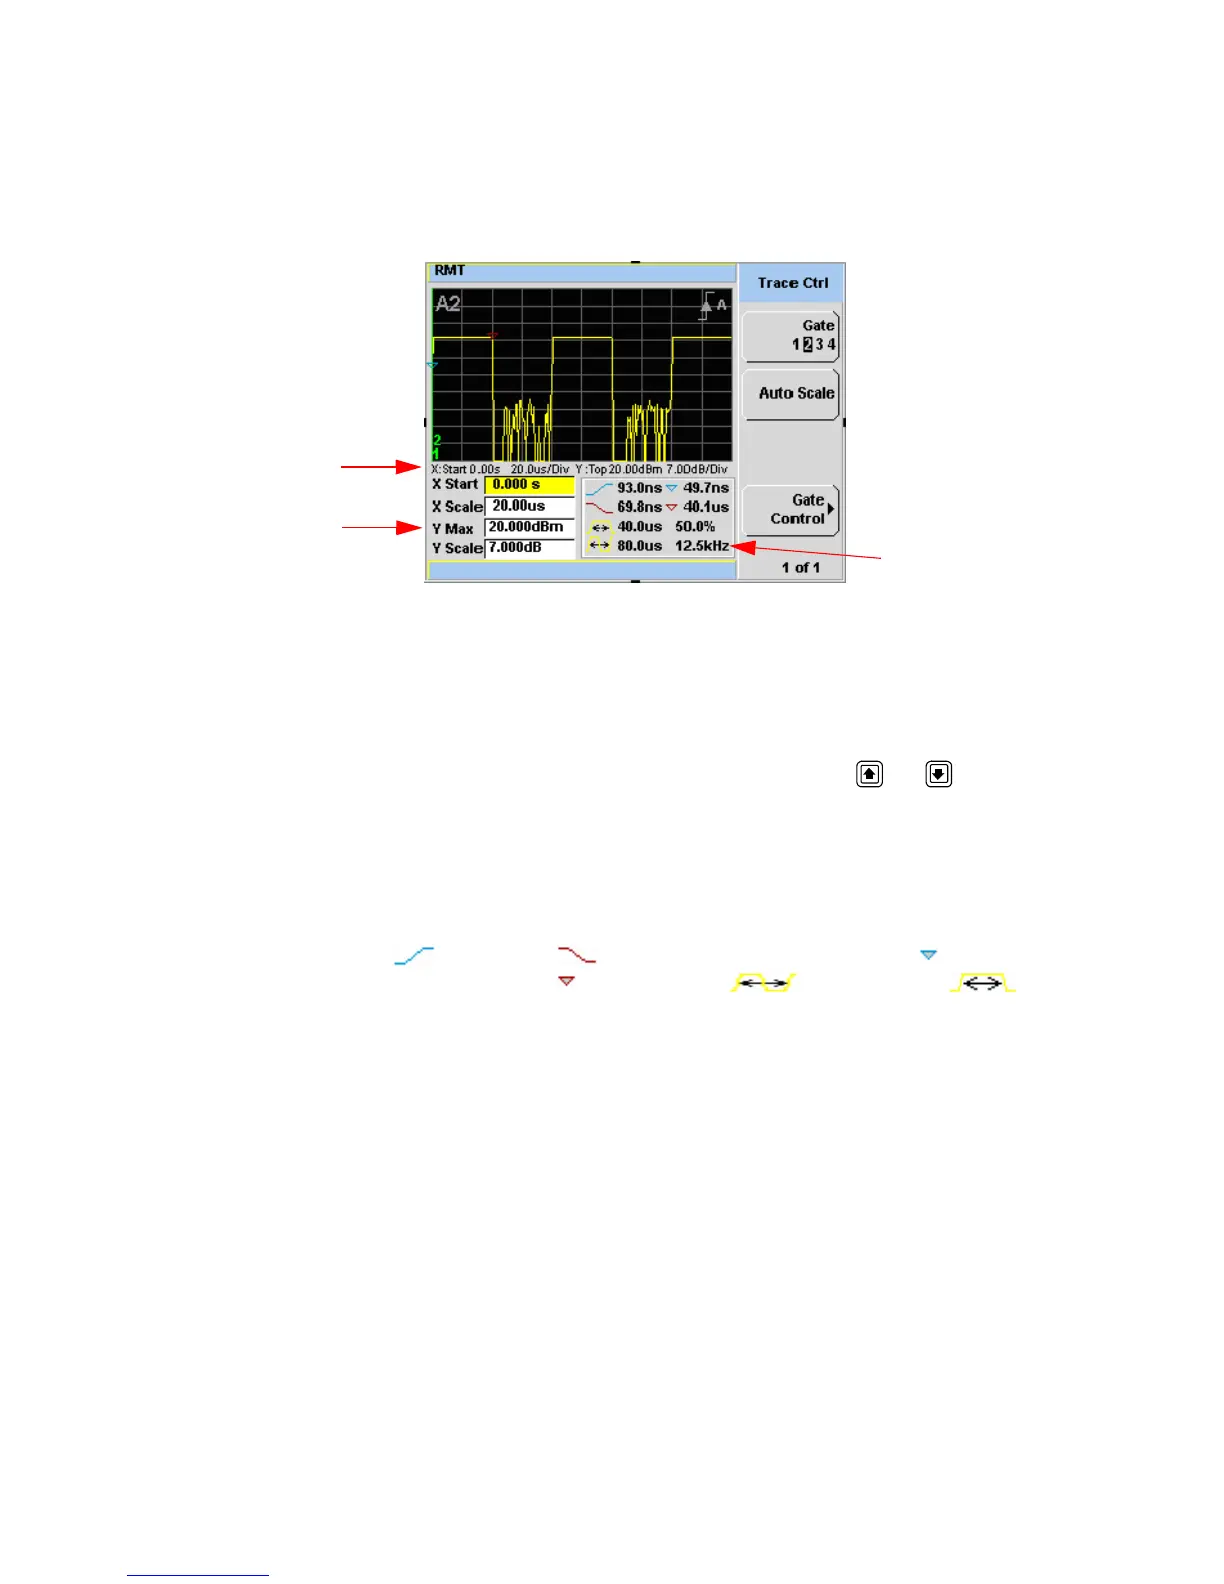
Figure 1-7 Trace display in single enlarged window in trace control mode
Figure 1- 7 shows a single enlarged window with the Trace Ctrl menu with
information on the pulse and associated X and Y control.
33 This is the X and Y trace setup fields. Using the or keys you can
highlight the item and change its value.
34 The current settings of the X and Y scale are displayed in this reporting
line.
35 This table shows 8 automatic time measurements performed on the first
complete captured pulse after the trigger. The 8 measurements are rise
time , fall time , time to positive occurrence , time to
negative occurrence , pulse period , pulse width , duty
cycle 50.0 % and pulse repetitive frequency 12.5 kHz.

 Loading...