5.8 Measuring Optical Amplifier (Wavelength Division Multiplex)
5-81
5
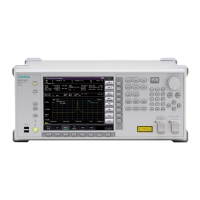
The actual resolution for each signal is obtained as follows based on the
values obtained in 1. and 2.
Figure 5.8.4-1 Integration Range for Signals in Multiple Channels
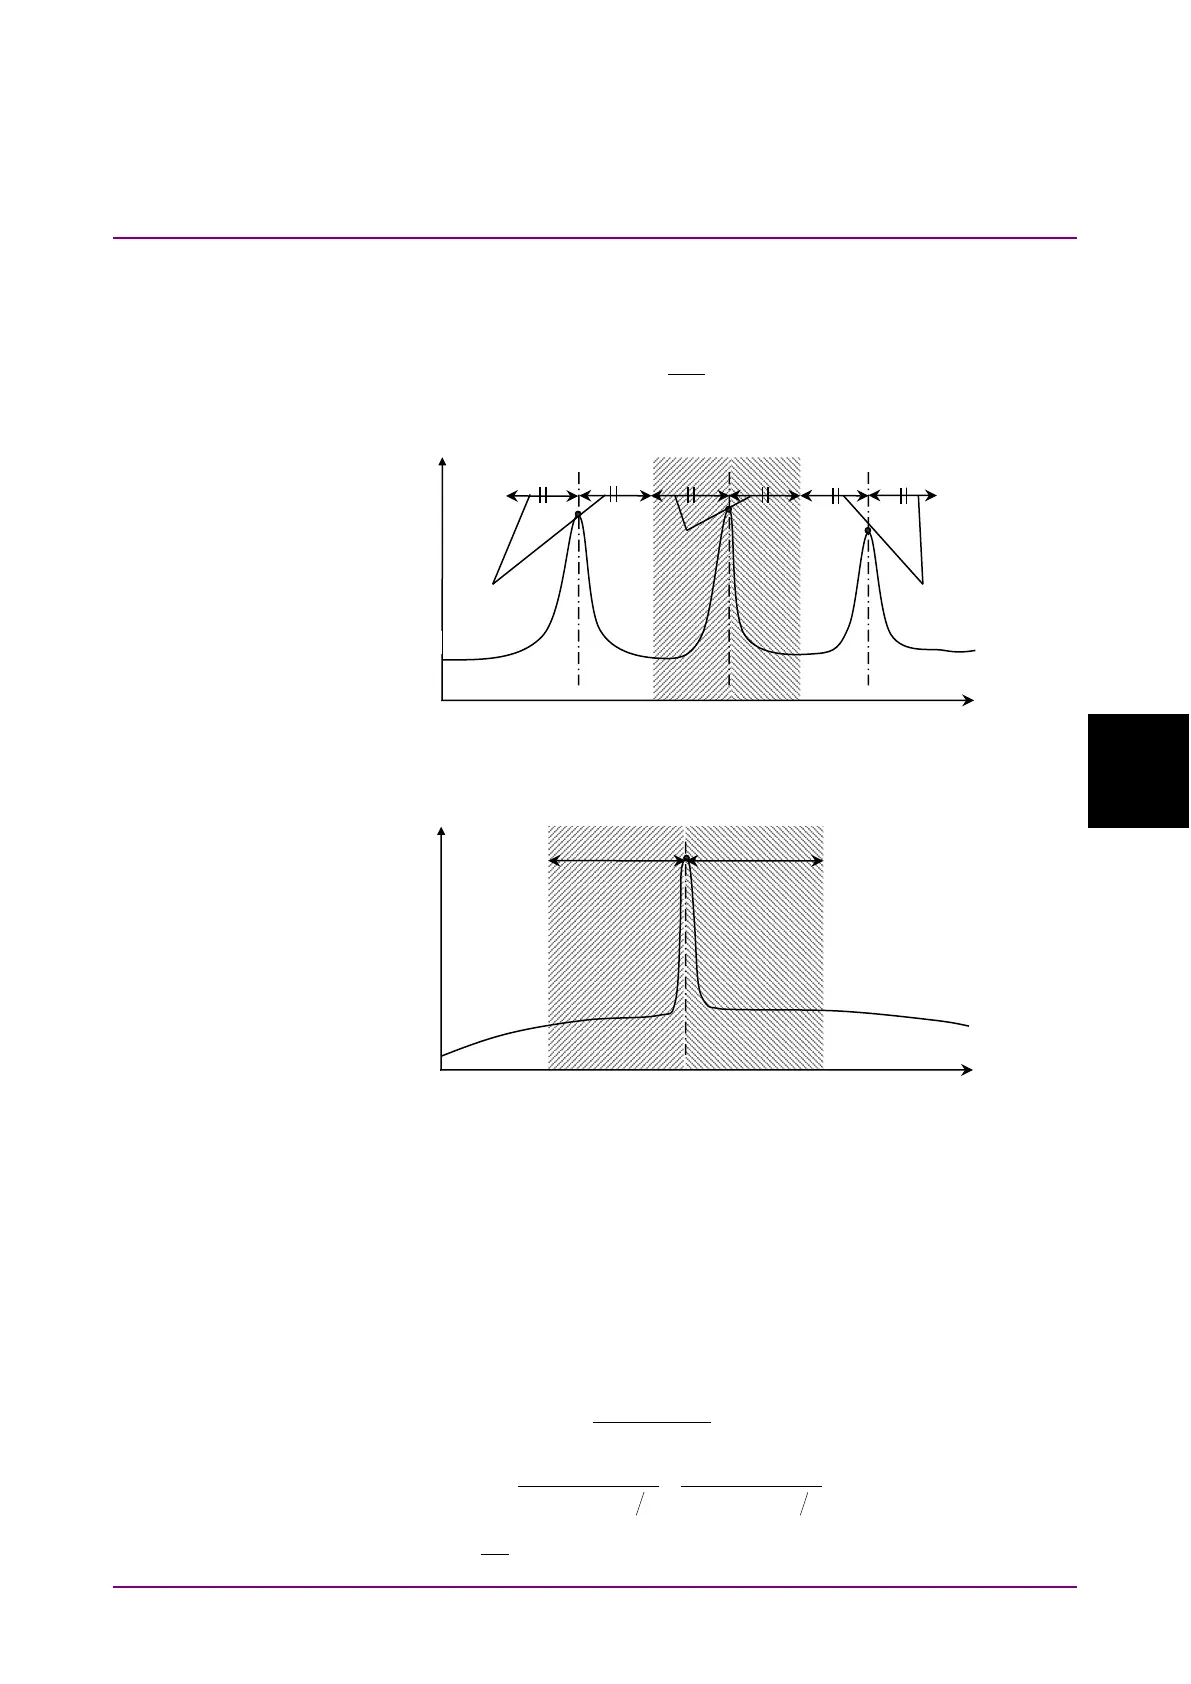
Figure 5.8.4-2 Integration Range for Only One Signal
When the Actual Resolution is Initial
This uses a value set at time of shipment.
Noise figure NF (dB) Calculation Method
When NF Select is S-ASE
The noise figure is calculated from the beat noise between the optical
signal and the ASE optical output.
)log(10
vsG
h
Pase
k
NF
∆⋅⋅
⋅
⋅=
ν
9
10)
2Re
1
2Re
1
( ⋅⋅
+
−
−
=∆ c
ss
s
realsvrealsv
ll
ν
1
(Res)
(Res)
1
2
3
value