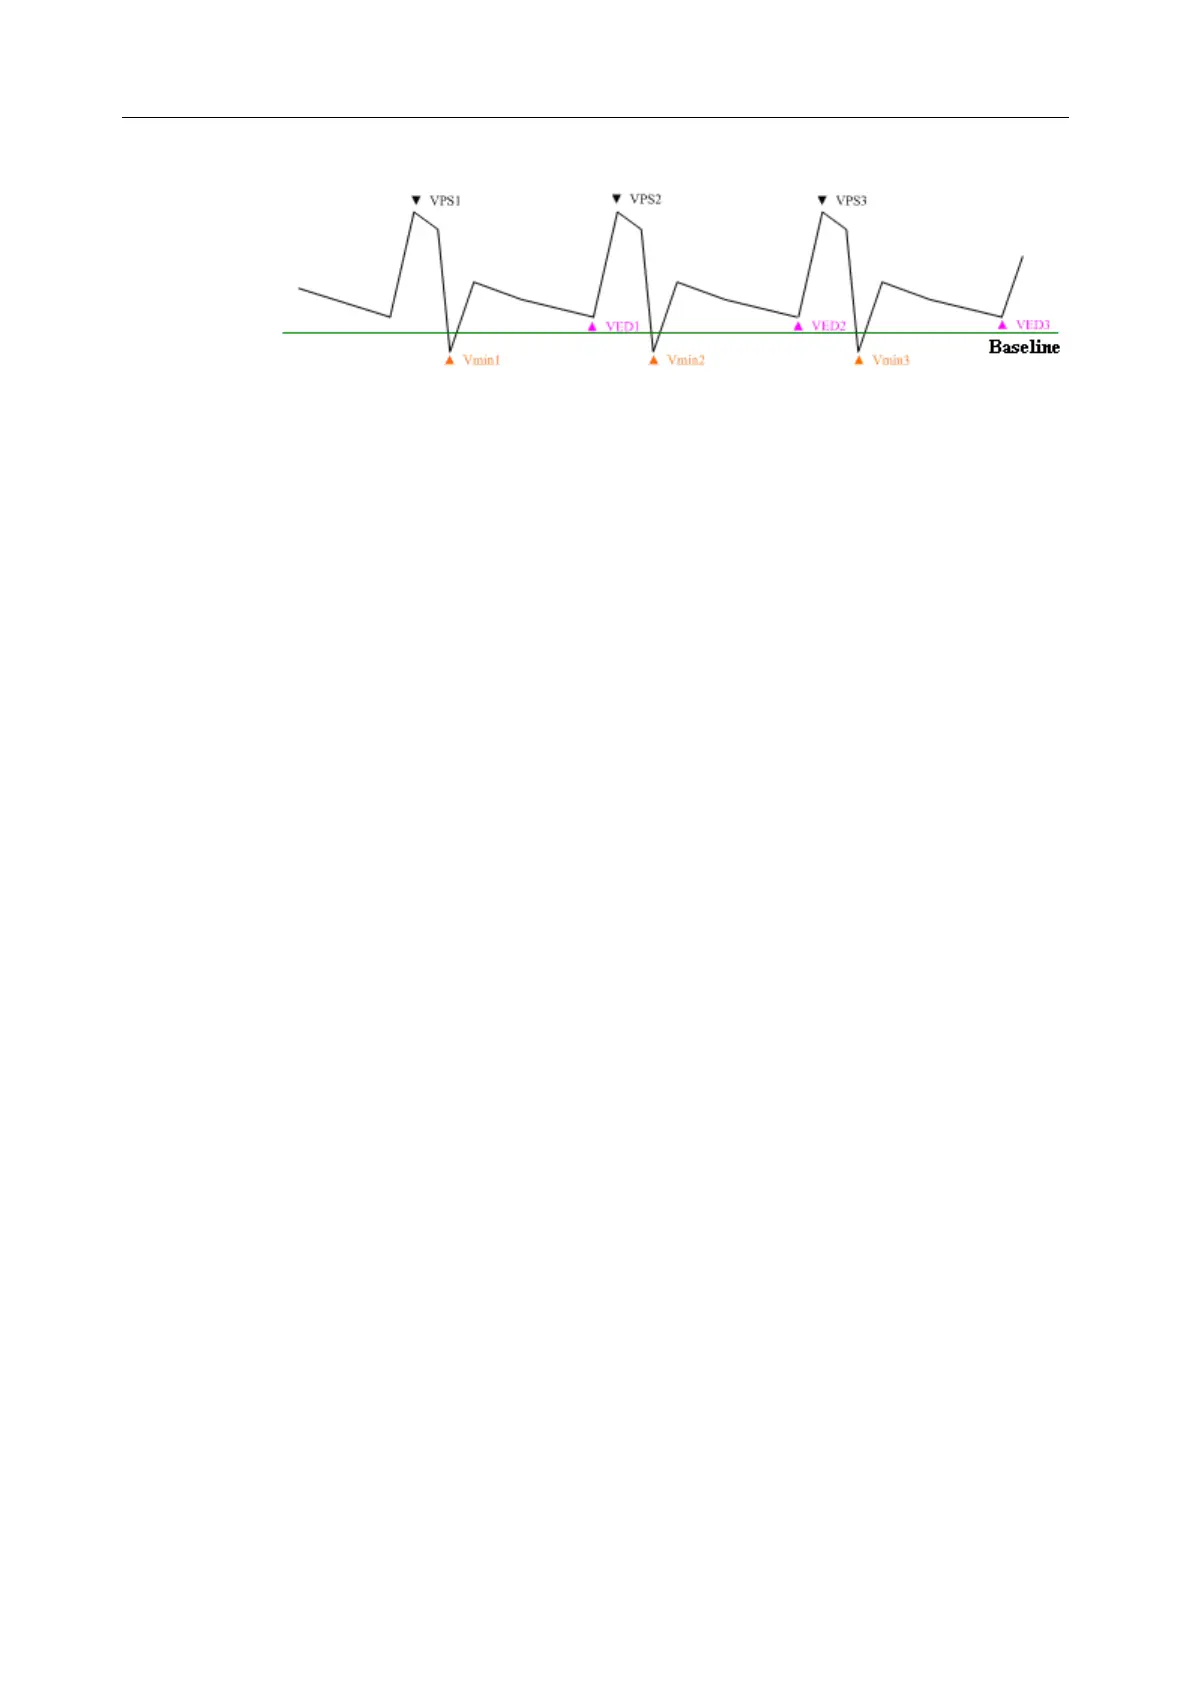
The trace in PW mode is shown below:
Figure 6-19 Trace Diagram
Where,
VPS is the maximum velocity in the cycle;
VED is the velocity at the end of diastole;
V
min
is the minimum velocity in the cycle.
NOTE:
Freeze the system before performing the tracing function.
To perform Auto Trace function (automatic tracing)
1. Press Caliper to activate a measurement cursor “+”. Before tracing, press
Trace Direction menu control, select Above/Below/Both to trace spectrum
only above the baseline, or only below the baseline, or both above and below
the baseline respectively.
2. Roll the trackball to highlight Auto and press Set.
3. A big “+” is displayed, roll the trackball and press Set to anchor the start
point.
4. Roll the trackball, press Set to anchor the end point, and the system displays
the results of PS, ED, RI, PI, etc. in measurement result window.
5. After a trace measurement, press Trace Sensitivity+ menu control to increase
the identification sensitivity to the spectrum, the bigger the value, the higher
the sensitivity, and the less spectrum information to be removed, and the
higher degree of overlapping between trace line and spectrum. Or press Trace
Sensitivity- to decrease the sensitivity.
6. Roll the trackball and press Set to begin a new tracing measurement. You can
measure a maximum of eight groups of data. The outcome will be displayed
in the measurement result window.
7. Press Caliper to finish and exit.