78
IMPORTANT NOTES
It is important to understand the information available on these graphs, as well as the information
that is not available:
• The “after” graphs show the effects of the optimization parameters. These graphs are therefore
based on calculations only, not on measurements. However, measurements with external test
systems have always proved the accuracy of these calculations.
• These graphs only take into account the automatic filters computed according to the Optimizer
Settings page, not the manual adjustments made in the Processor page.
• The display settings will be saved in preset.
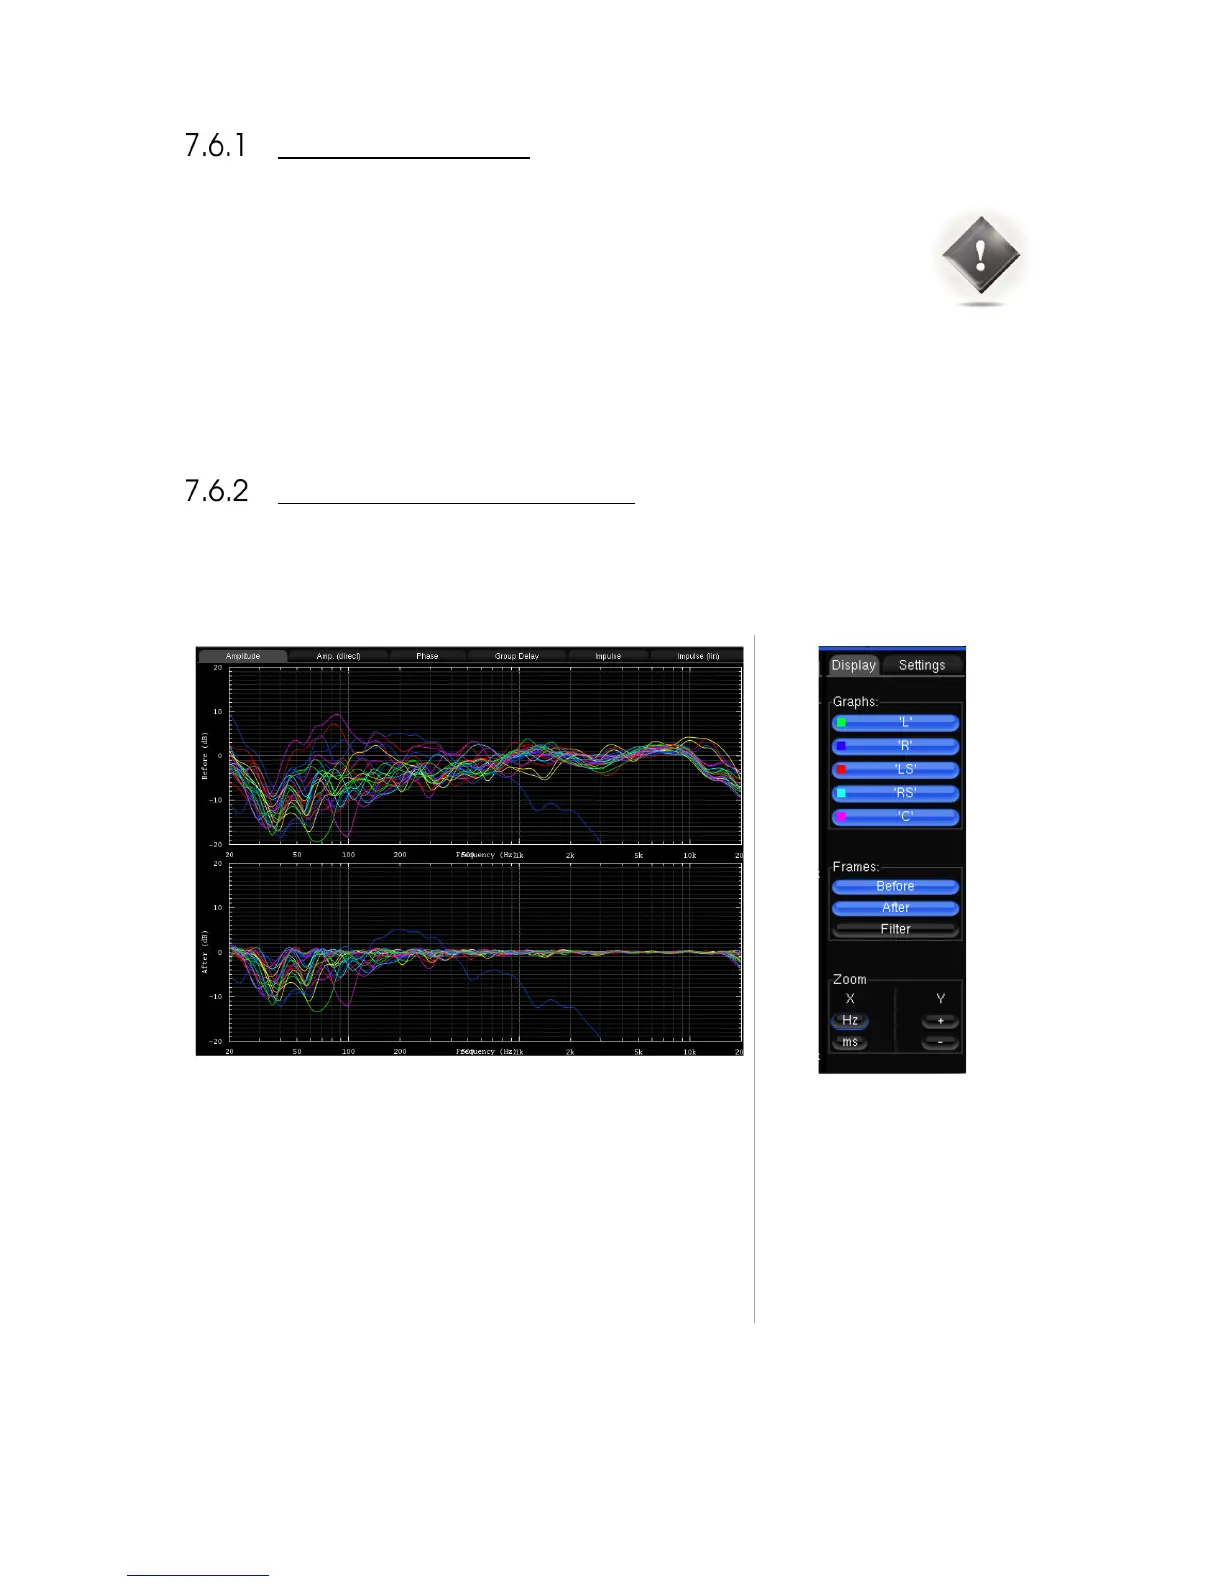
GRAPHS DISPLAY OPTIONS
The Optimizer Graphs page consist of a Display area on the left, and a Config area on the right.
The Configuration area is organized
in:
• A Display tab
• A Settings tab
Zoom options allows modifying
amplitude, frequency and time
scales according to the type of
representation.