79
CHOOSE DISPLAY OPTIONS ACCORDING TO YOUR
REQUIREMENTS
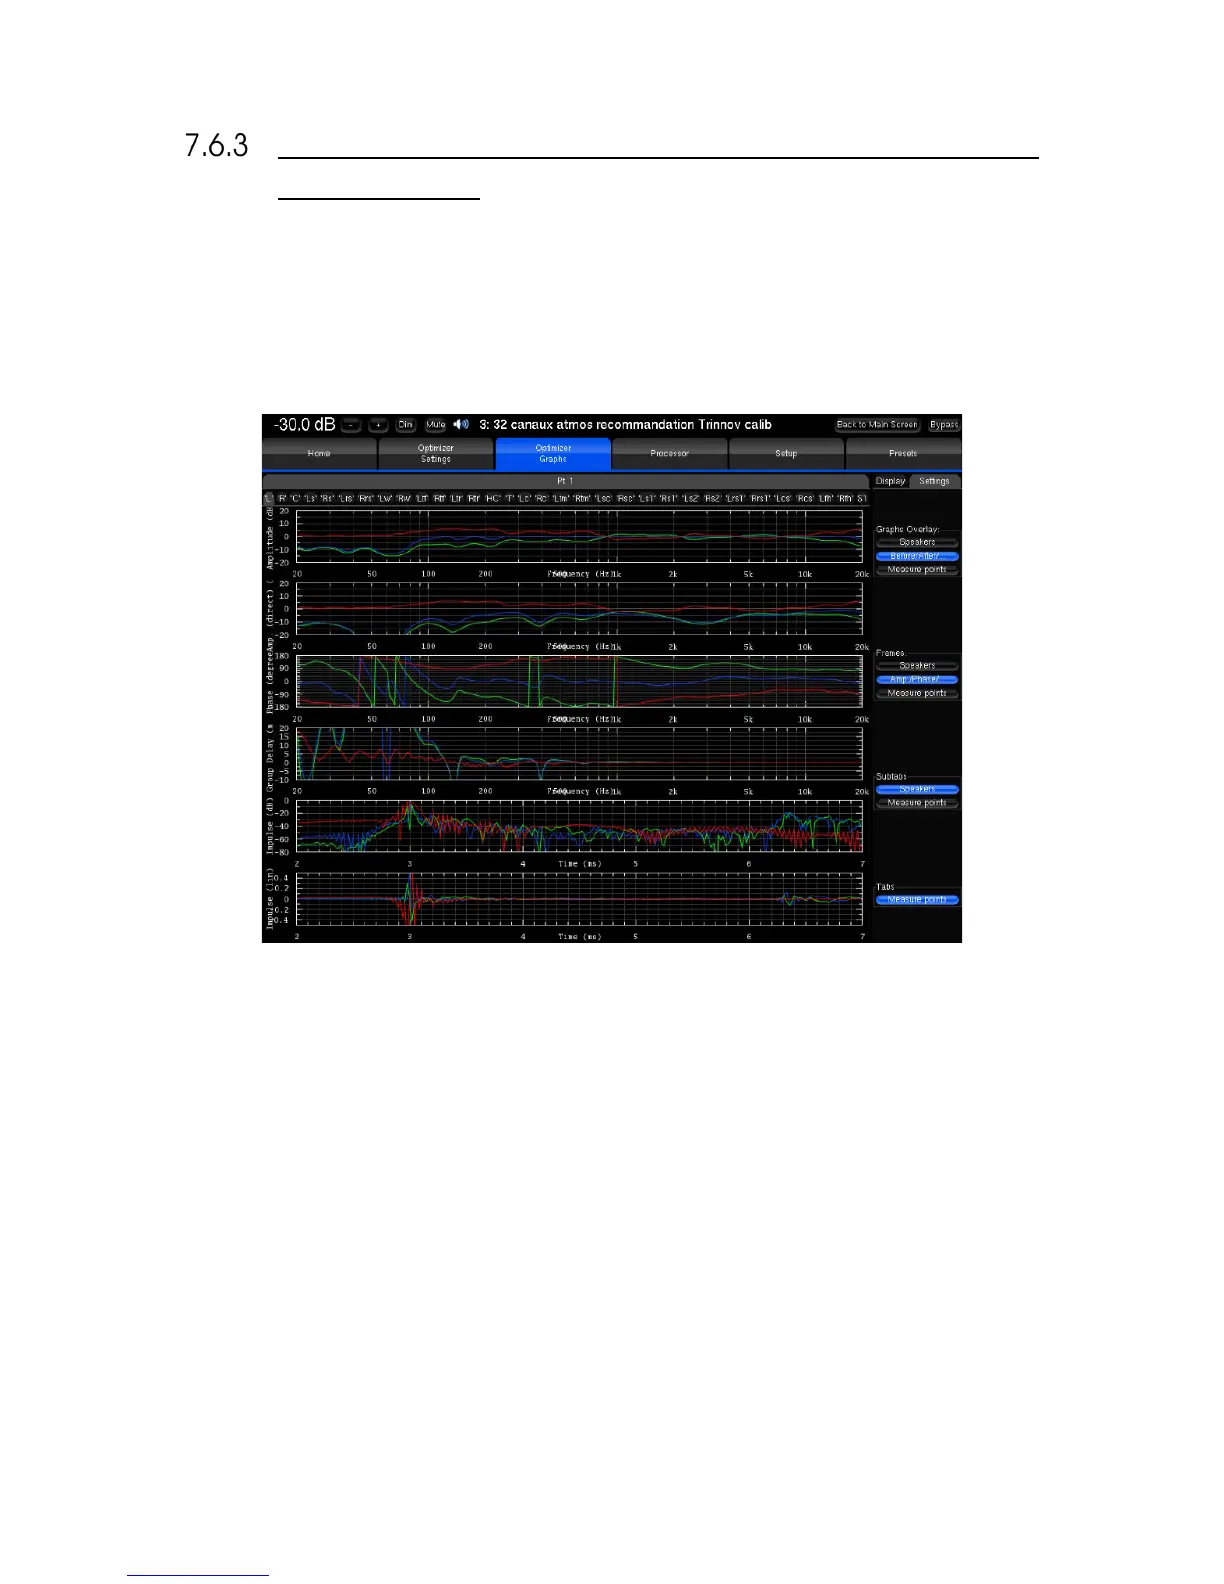
This feature allows you to visualize on a same screen various type of data, which you can organize as you wish by a few
parameters:
• The Graphs Overlay: type of data you want to overlay on a same graph (or Frame)
• The Frames: type of data displayed vertically on a same tab
• The type of data you want to visualize on each tab and sub-tab.
Figure#56:#Comprehensive#acoustical#graphs#
For each level, you can order the data through various criteria:
• The speaker (L, R, C, Sub, ...)
• The point of measurement: in the case of a multipoint configuration, you can visualize the response measured on
each position, and the effect the optimization has on it
• The type of response: speaker response before optimization, speaker response after optimization, or filter response
• The type of visualization: amplitude, amplitude of the direct front and early reflections only, phase, group delay, or
impulse response.