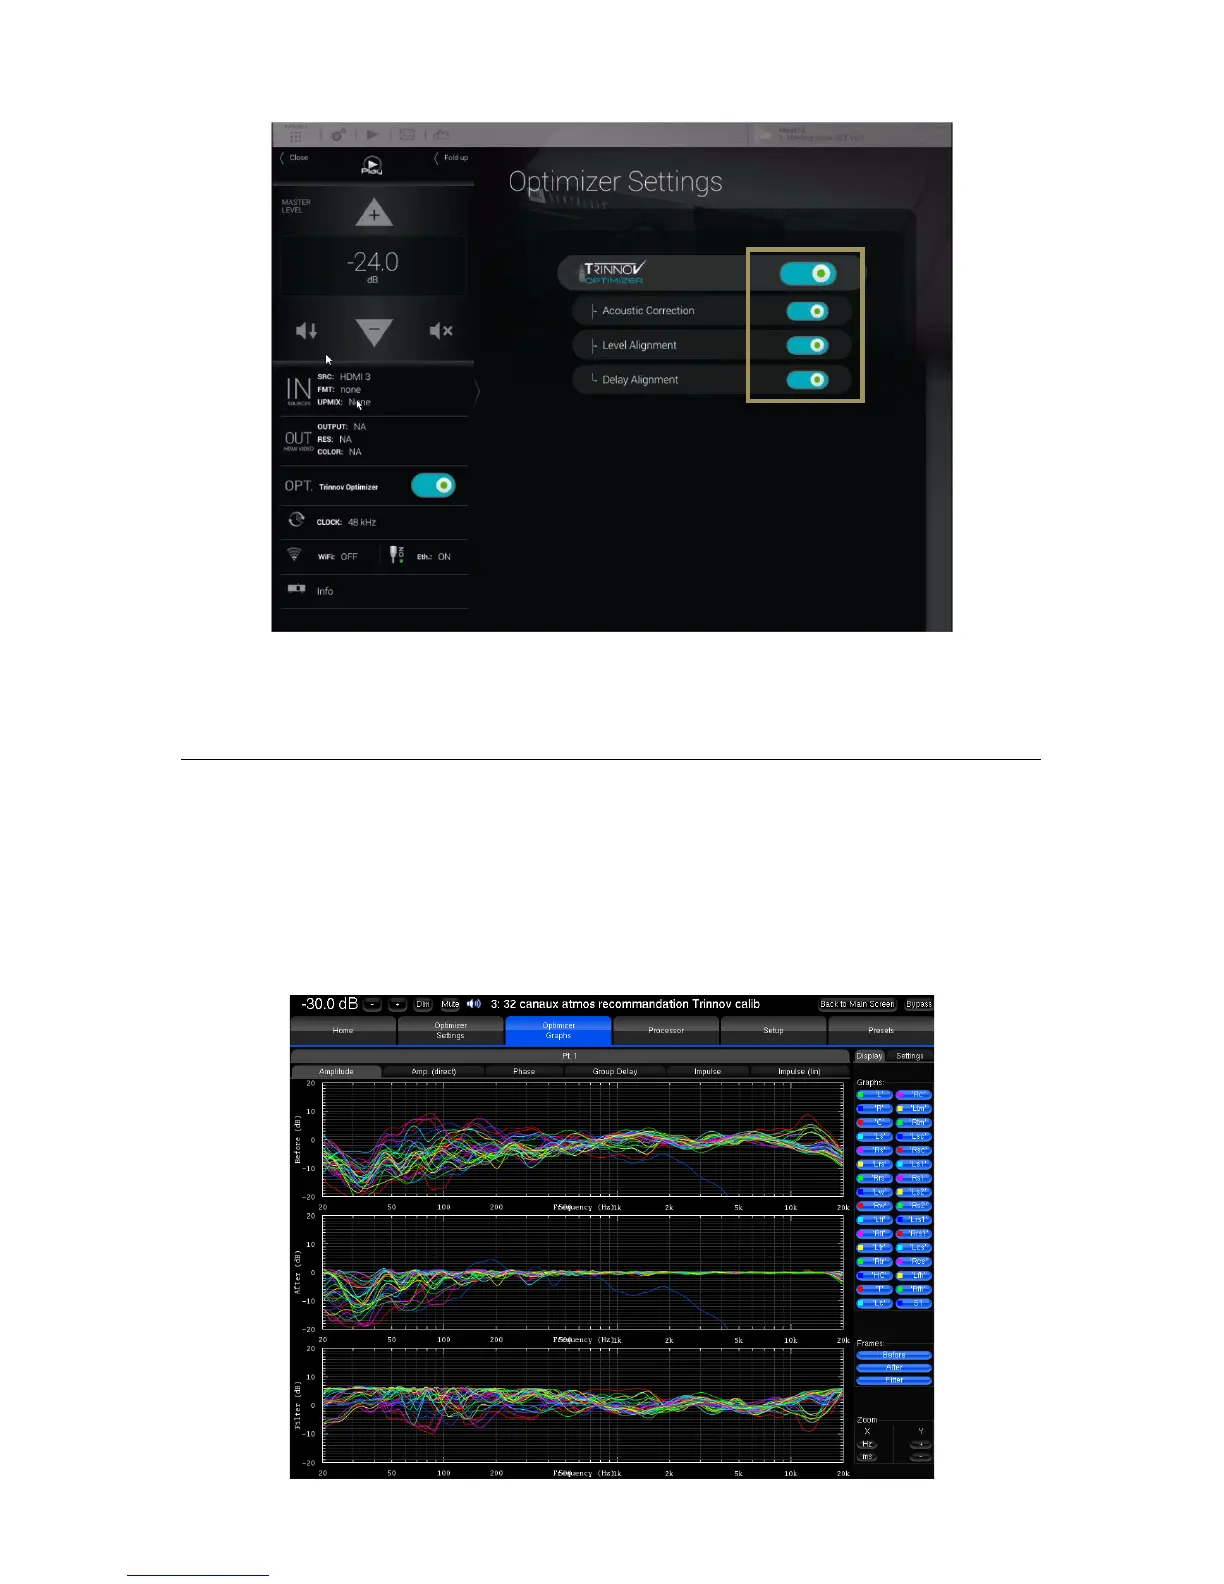
77
Figure#54:#switching#the#Optimization##on/off#in#the#Main#user#interface#
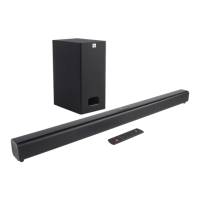
7.6 VIEWING THE ACOUSTICAL GRAPHS
The SDP-75
is a complete and flexible tool for displaying the responses of the speakers before and after the Trinnov
optimization, as well as the correction filters.
The acoustical graphs are available in the Optimizer Graphs page of the Advanced user interface. It is possible to display
the acoustic responses of multiple speakers and analyze the information from various points of view: amplitude, phase,
group delay, impulse response…
Figure#55:#the#acoustical#graphs#page#