Buffer statistics
The MAX AT and MIN AT values are the maximum and minimum values in the buffer. The
AVERAGE value is the mean of the buffered readings. The equation used to calculate the mean
is:
where: X
i
is a stored reading.
n is the number of stored readings.
The STD DEV value is the standard deviation of the buffered readings. The equation used to
calculate the standard deviation is:
where: X
i
is a stored reading.
n is the number of stored readings.
NOTE The Model 2010 uses IEEE-754 floating point format for math calculations.
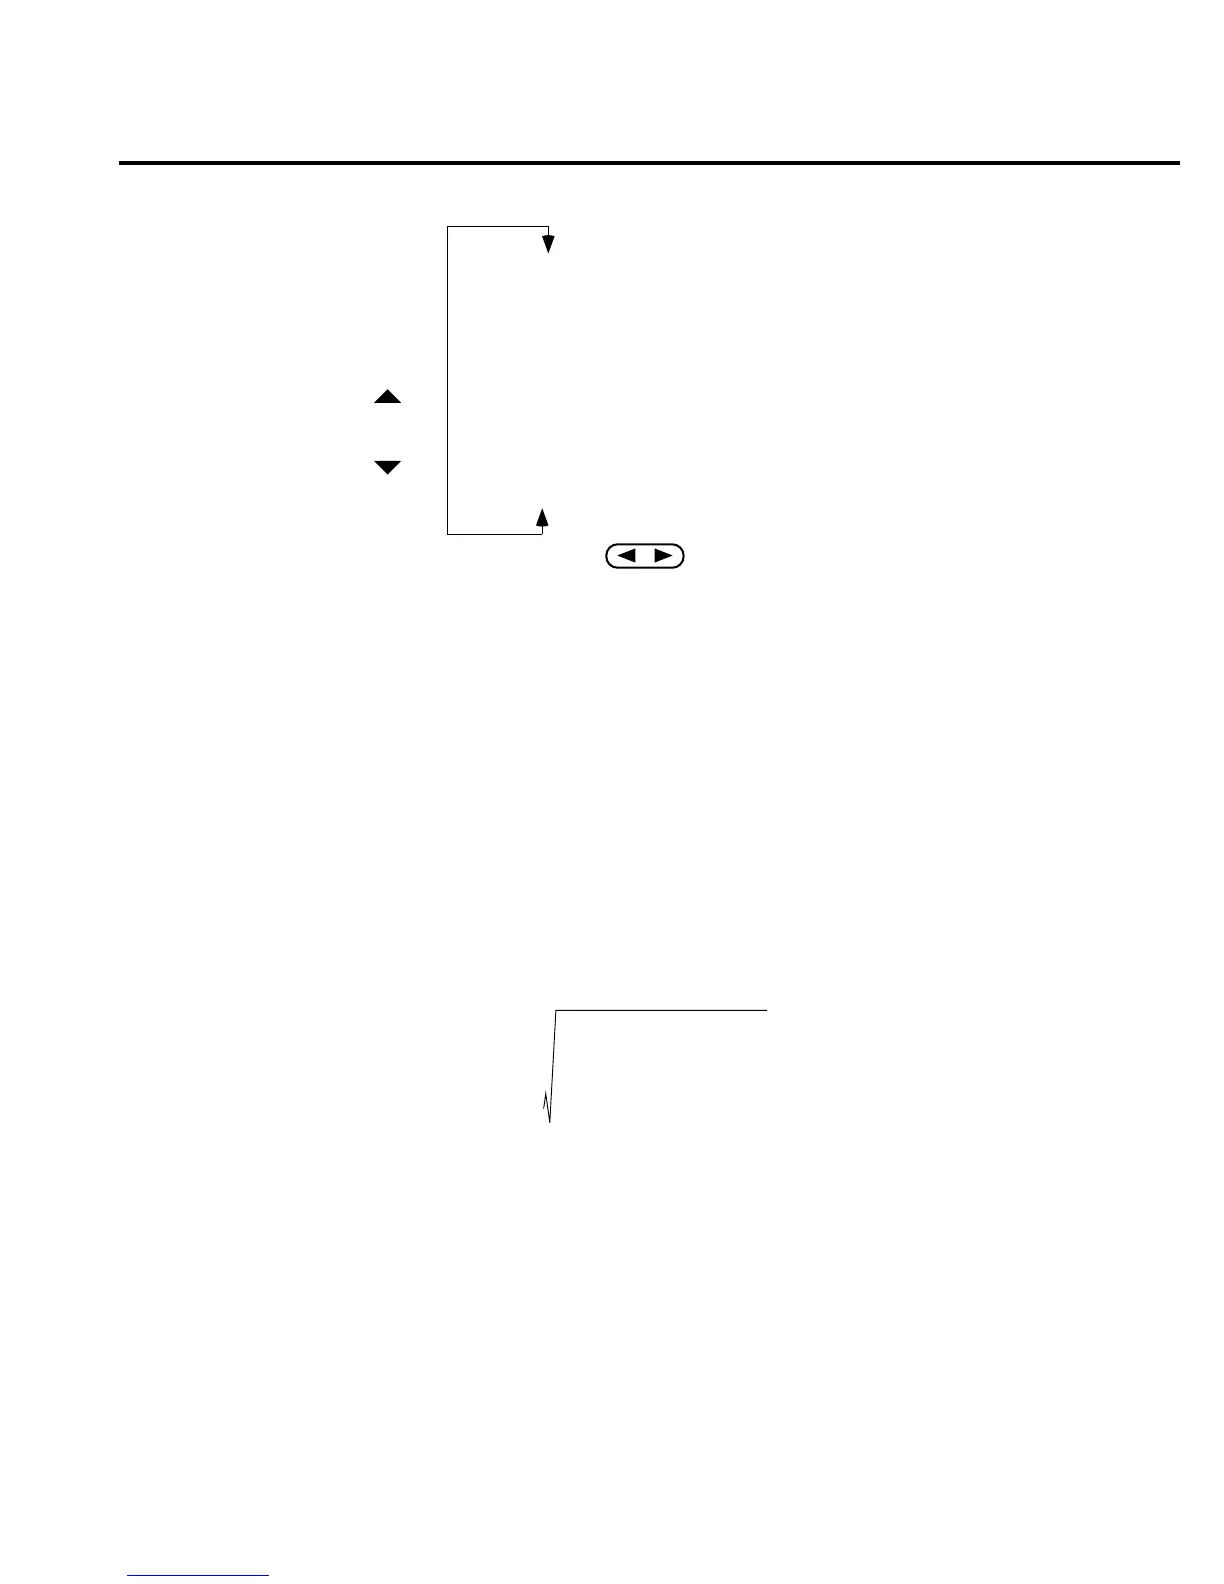
RDG NO. 10 Reading Value
RDG NO. 9 Reading Value
RDG NO. 8 Reading Value
RDG NO. 7 Reading Value
RDG NO. 6 Reading Value
RDG NO. 5 Reading Value
RDG NO. 4 Reading Value
RDG NO. 3 Reading Value
RDG NO. 2 Reading Value
RDG NO. 1 Reading Value
STD DEV Standard Deviation Value
Average Average Value
Min At XX Minimum Value
Max At XX Maximum Value
RANGE
RANGE
gure
-
uffer locations
y
X
i
i1=
n
∑
n
-----------------=
X
2
i
i1=
n
∑
1
n
---X
i
i1=
n
∑
2
–
n-1
--------------------------------------------------------------
y =
Measurement Options 3-17
 Loading...