Section 2 NS Series Functions 2-16 Broken-line Graphs
2-374
NS Series Programming Manual
No. Setting Details
5 Draw the value
outside of
range
The following diagrams show the display when
Draw the value outside of range is
selected.
Draw the value outside of range selected:
Values outside the range will be displayed at the top of the graph.
Draw the values outside of range not selected:
Values outside the range will not be displayed.
6 Storage type Select the storage type from the pull-down list to the right. Refer to Numeral Display
and Storage Type under 2-8 Common Functional Object Functions for details.
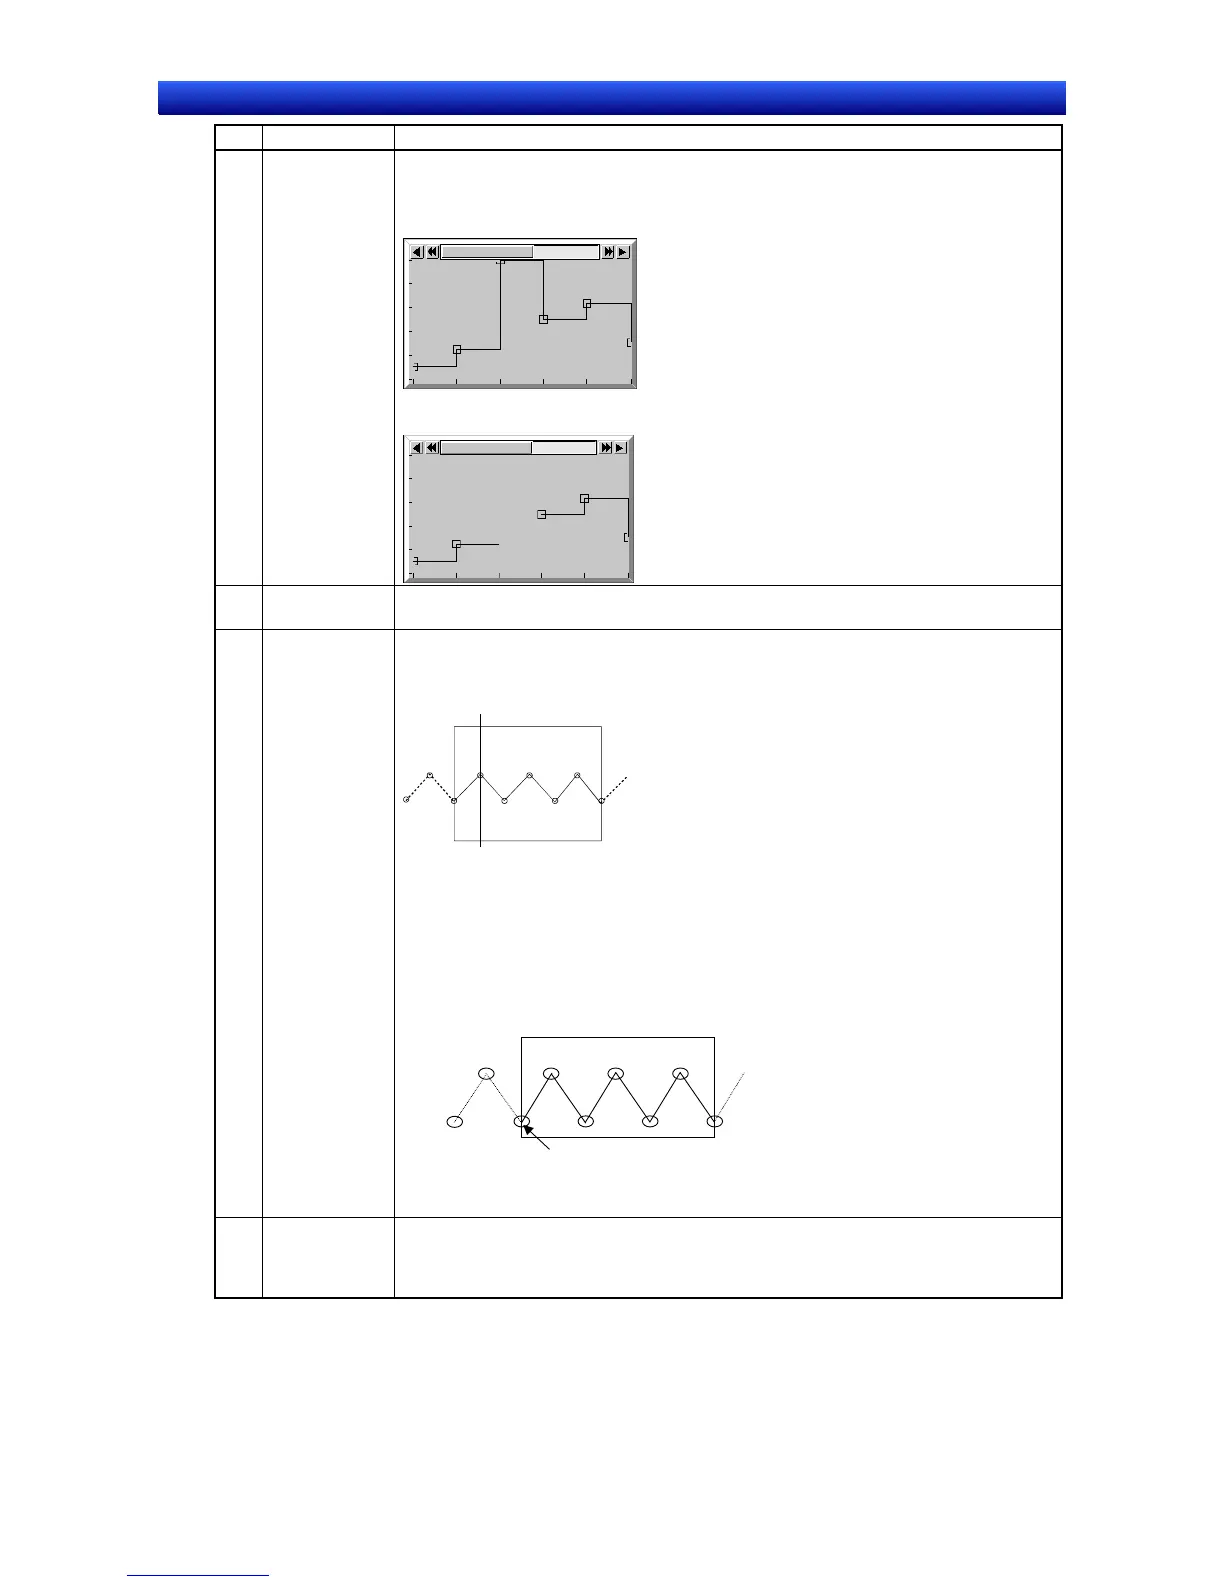
7 No. of points
for each graph
line
Sets the number of points monitored on the broken-line graph under Monitor points.
Sets the number of points displayed on the broken-line graph object under Display
points.
Set a Display points value smaller than the value set to Monitor points.)
No. of display points: 7
No. of monitor points: 9
The two points not displayed can be viewed b
scrolling the display down with the Scroll Button.
The
Display start position sets the broken-line graph’s a starting display position.
The start position is treated as point 0.
Set a display start position that is smaller than the difference of the Monitor Points –
Display Points. When the Indirect reference is specified, the value of the specified
address is used for the display start position.
Point 0
(First monitor position)
Point 1
Point 2
(Display start position)
Display start position [2]
8
Use the graph
of a broken-
line graph
group
Leave this option unselected when registering graph lines that will be displayed in an
individual broken-line graph. (Select this option when displaying a graph belonging to
a broken-line graph group.)

 Loading...