Page 98 160337-000 Rev D, 30 September, 2013 Xiotech—Proprietary
ISE User Guide ISE Management
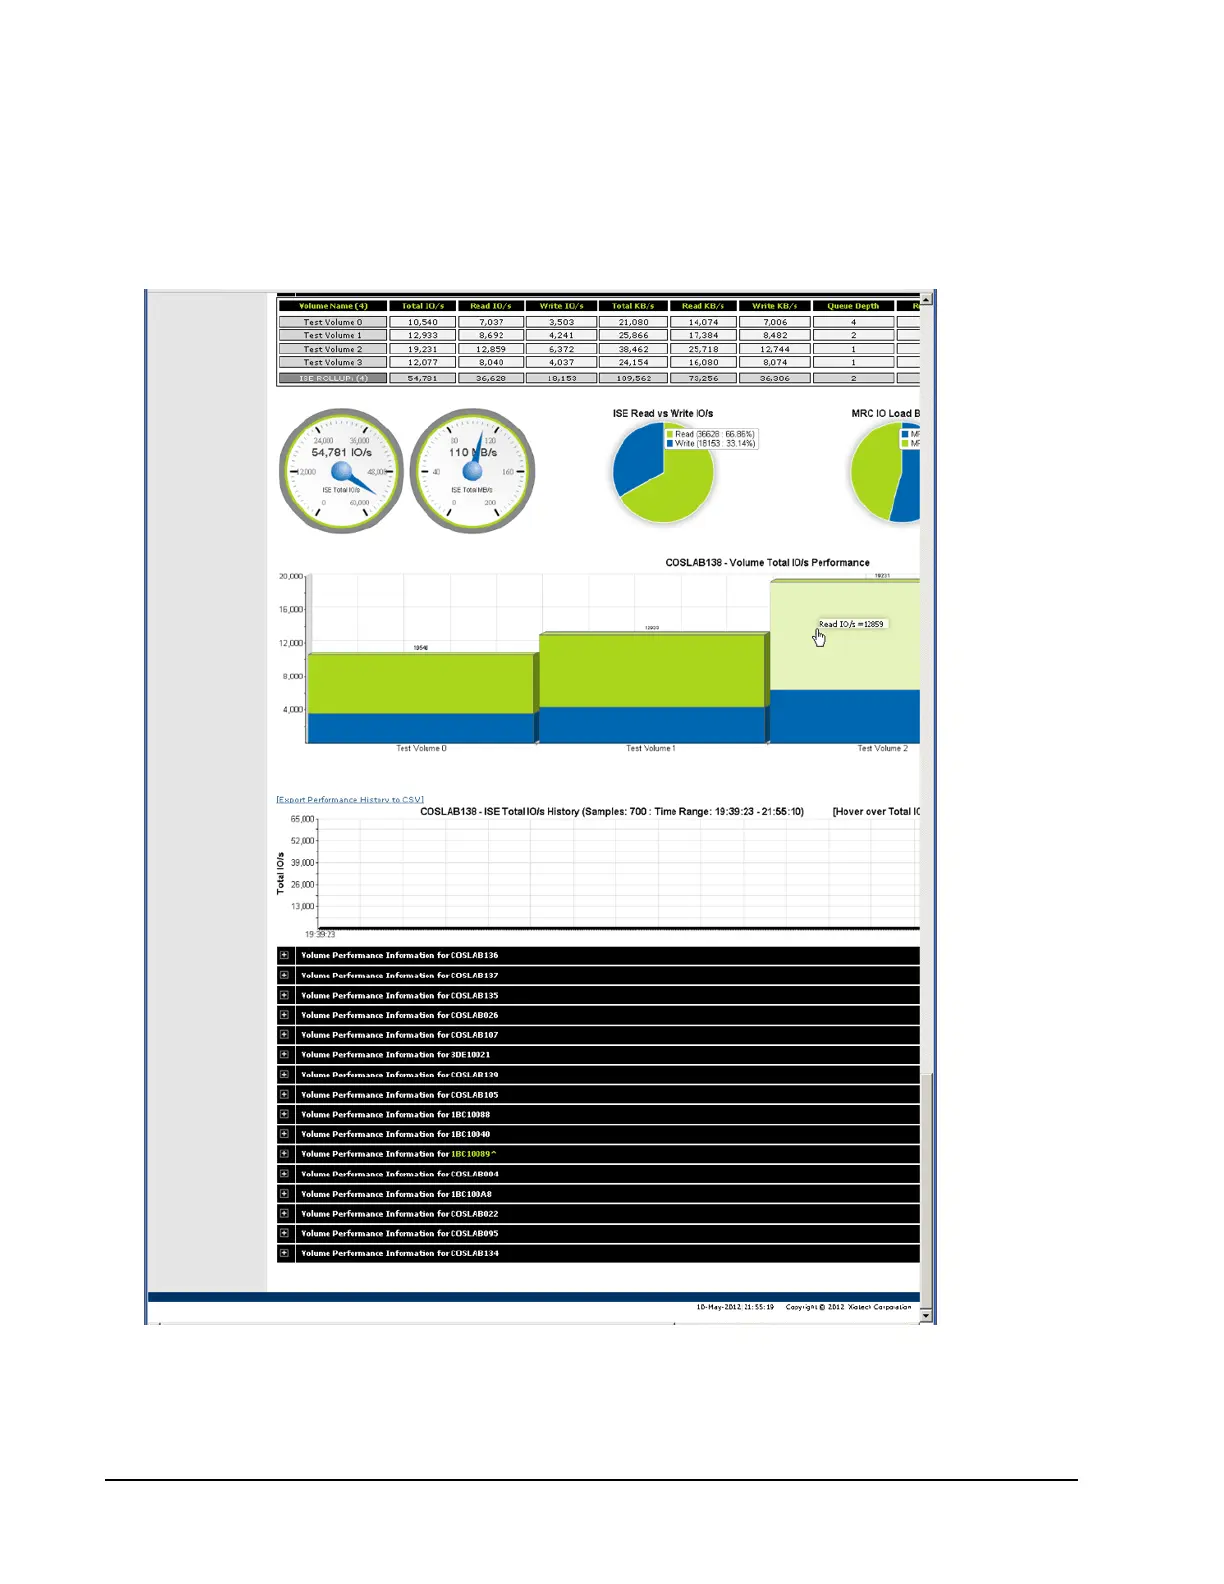
The Performance view includes the overall throughput in a gauge format as well as a bar graph.
The ISE Systems Performance Dashboard listing all monitored ISE systems can be collapsed to display the
horizontal bar chart in a Network Operations Center mode to show total throughput and bandwidth across all
the ISE systems.
The Individual ISE Performance Dashboard bar expands to show all the ISE performance bars, giving a picture
of the current performance metrics for all ISE systems and volumes.
Figure 71. Web ISE Performance (cont.)—Systems Management Dashboard
 Loading...