Analog Duplex System
Subject to Export Control, see Cover Page for details.
8-30
Meters Tile
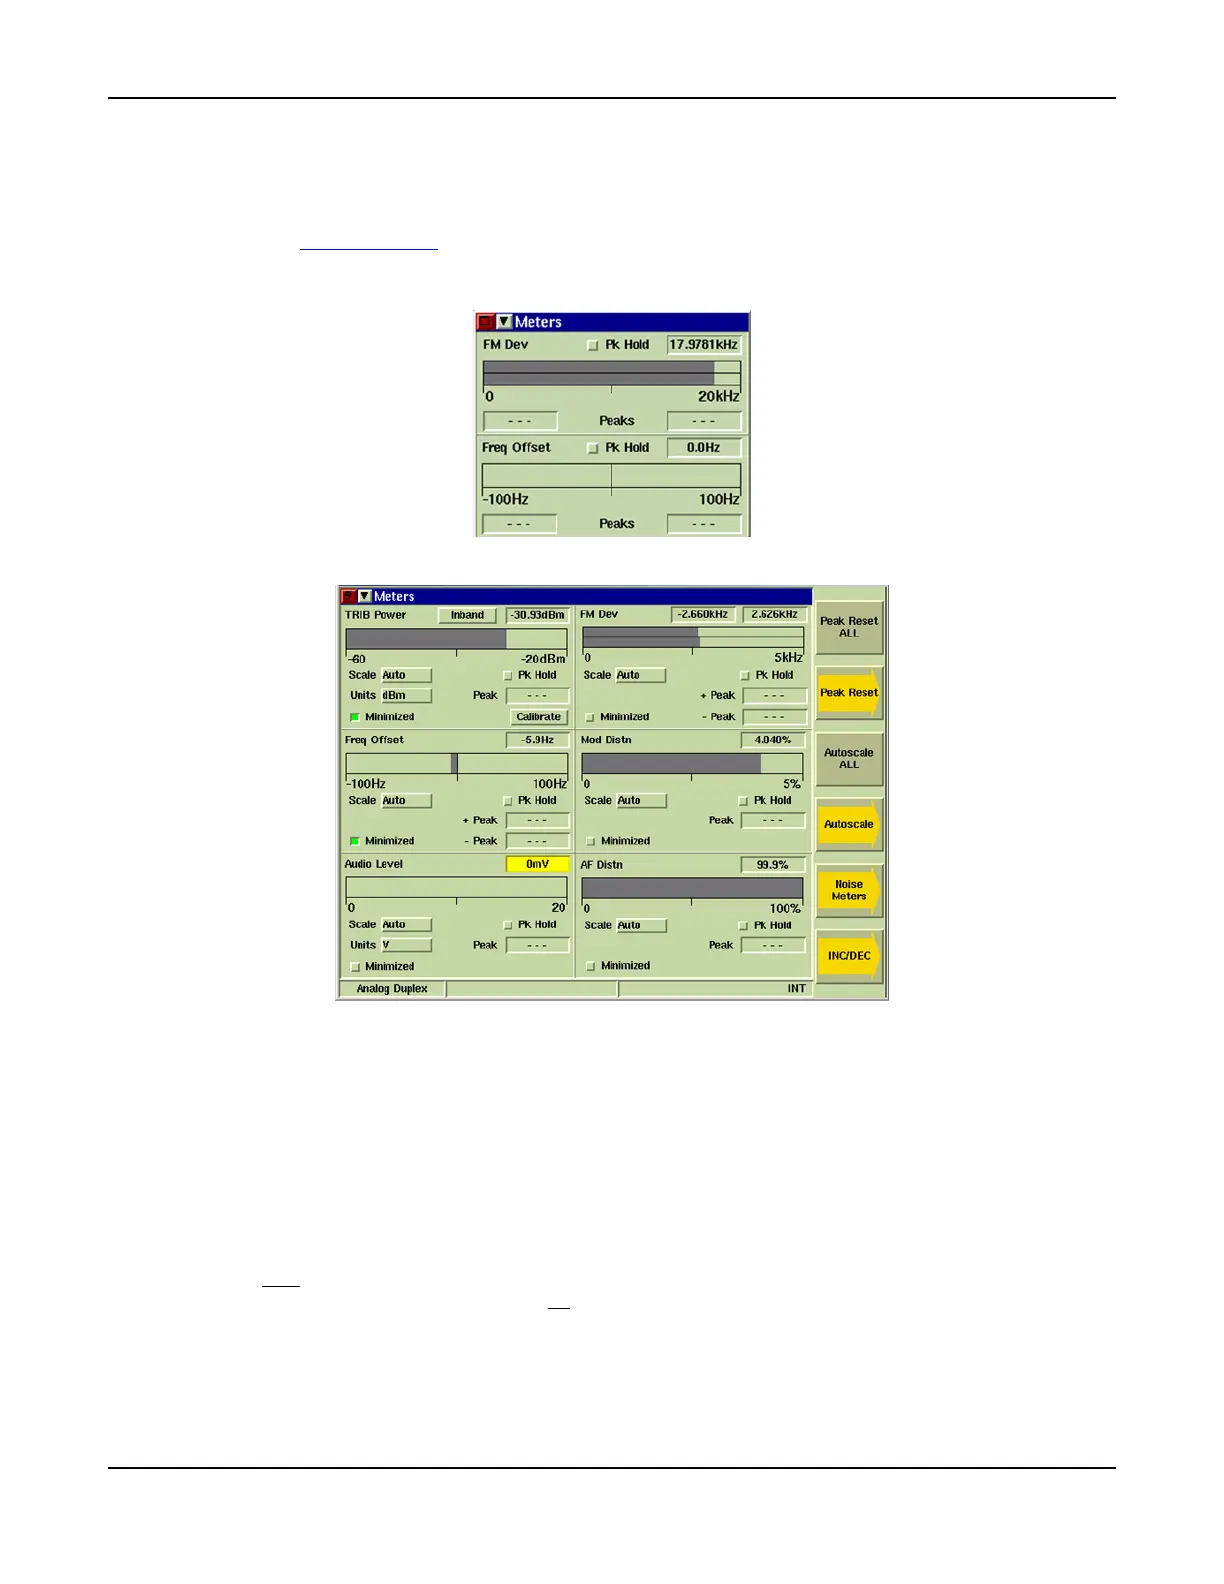
The Meters Tile displays the results of RF, AF and modulation measurements performed on signals
from equipment under test. The fields present on the display vary according to the Demod setting
selected on the Analyzers Tile
. When maximized (example below) six meters are displayed: up to
three of these meters can be selected for display on the minimized Tile. The example below shows
the Frequency Offset and TRIB Power meters selected on the minimized Tile.
Fig. 8-23 Meters Tile - Minimized View - Freq Offset and TRIB Power Selected
Fig. 8-24 Meters Tile - Maximized View
Common Features
Each meter on the Meter Tile contains similar data fields.
Measurement Digital Readout
The measurement results are displayed as a digital readout at the top right of the meter panel.
For some measurements such as AM Depth, the positive and negative values of the
measurements are given.
Bar Graphs
The bar graphs provide a graphic representation of the measurement. Measurements that have
positive and
negative values, such as AM Depth, display a double bar to provide a comparative
reading. Measurements with positive or
negative values, such as Frequency Offset, use a
center-zero bar.