Radio Test Instruments
Subject to Export Control, see Cover Page for details.
7-35
Audio Analyzer Tile Layout
The Audio Analyzer can be viewed in minimized and maximized view. Fig. 7-38 shows the
maximized view of the Audio Analyzer. Fig. 7-43 shows the Audio Analyzer when minimized. Soft
Keys on the right side of the display provide access to settings not available on the main tile.
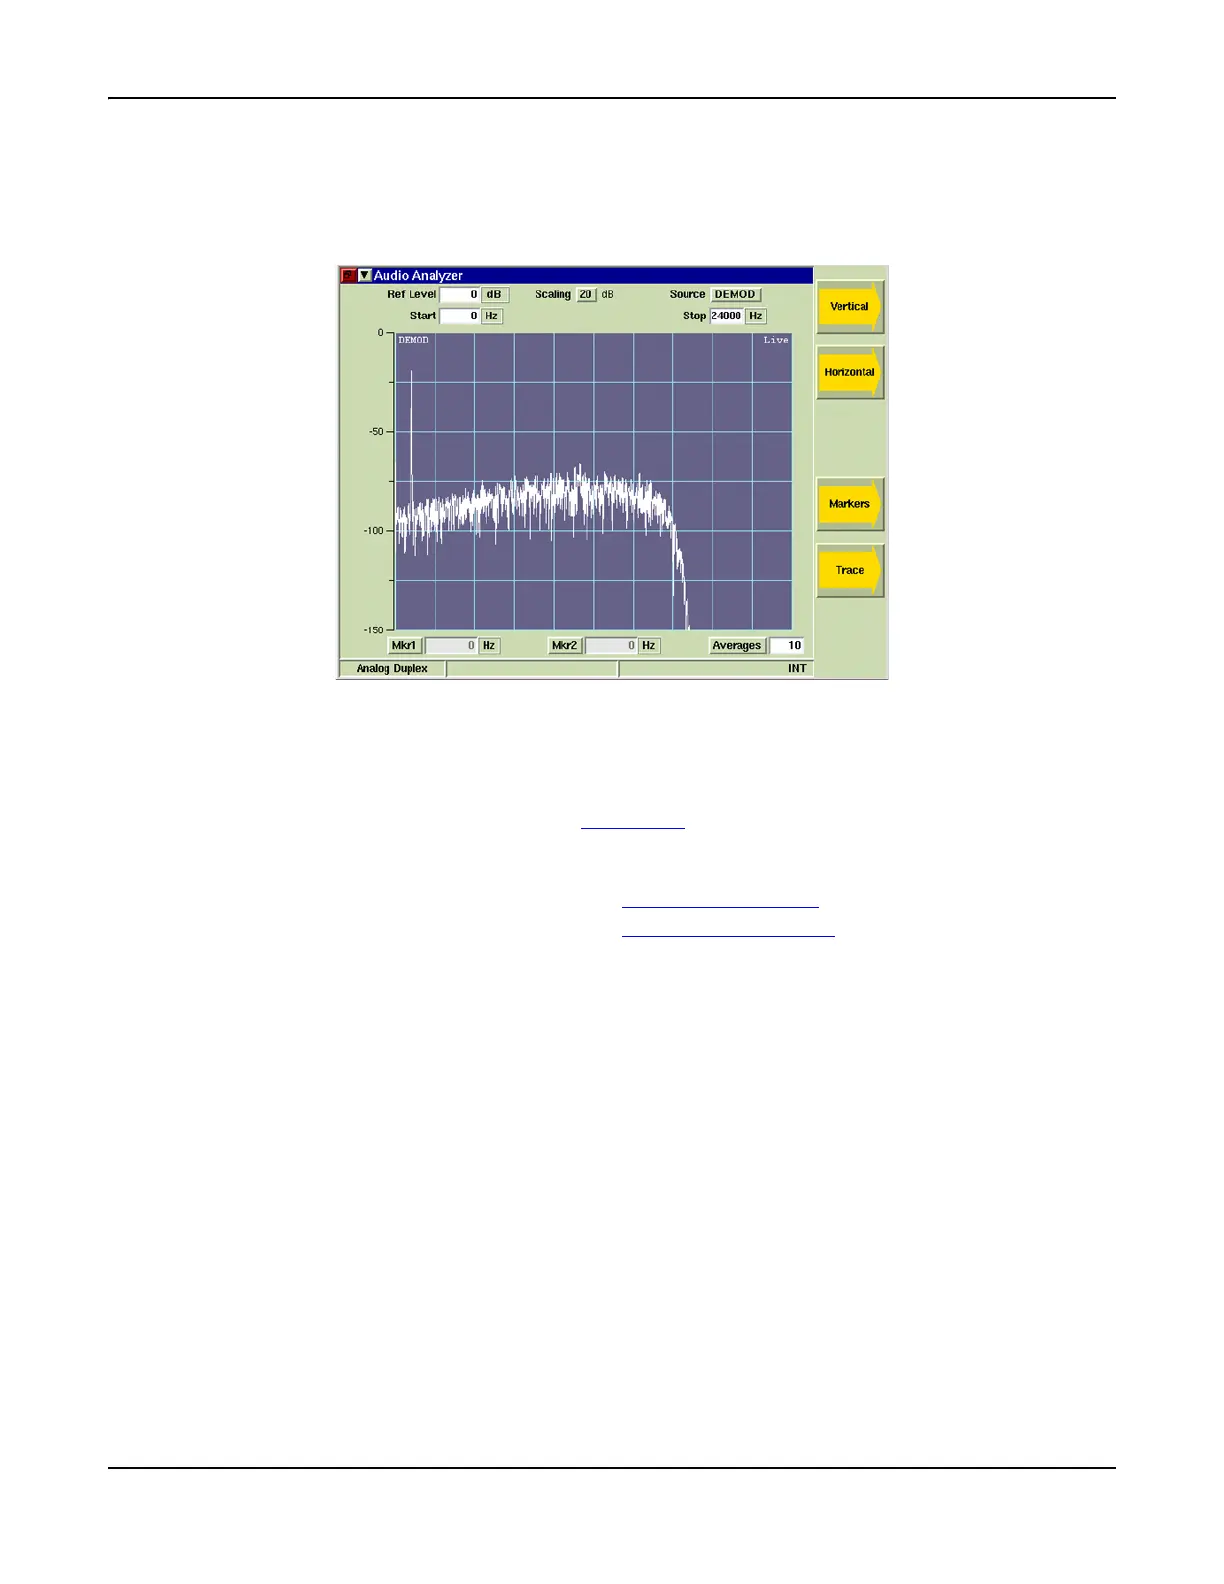
Fig. 7-38 Audio Analyzer Tile - Maximized View
Field/Soft Key Definitions
Reference Level
The Reference Level is the top value on the display grid. Power levels can be measured at any
point on the trace in conjunction with the Scaling dB
setting. The Reference Level can be set to
any value within the specified range. The Reference Level is adjusted by:
● Using the up/down arrow soft keys to adjust the level.
● Selecting the data field and using the Rotary Control Knob
to adjust the level.
● Selecting the data field and using the Data Entry Input Keys
to enter specific level.
Scaling dB
The Scaling drop-down menu defines the graph’s vertical scaling. The drop-down menu selects
from defined values of 1, 2, 5, 10 ro 20.
Source
Selects Demod or Audio as the filtered signal source. When a filter is selected, the signal source
is taken after the signal has been filtered. Filter selection is made on the Analyzers Tile of the
active operating Analog system.
Start
Defines the start frequency of the frequency span. The maximum span is 0 to 24000 Hz;
horizontal scale values must be within this range.
Stop
Defines the stop frequency of the frequency span. The maximum span is 0 to 24000 Hz;
horizontal scale values must be within this range.