Configuration with the web interface
98-150471-A02 Chapter 6: Configuration 6-35
Processing the statistics report in a spreadsheet application
The statistics report is in a data format that can be imported into spreadsheet applications,
e.g. Microsoft Excel, for further processing.
1. Save the zipped file to your computer and extract the text file. The file name contains
the identification of the system (example: adu-acu3_stat_20111021110901_day.csv).
2. Open the spreadsheet application, for example Microsoft Excel. On the tab Data click the
tab Import from text. Import the unzipped text file and follow the instructions in the
wizard. When asked about the delimiter, select ‘comma’.
The following figure shows an example of a statistics report in MS Excel 2007.
Pol.rx
Pol.tx
Current Rx and Tx polarisation modes
Rx Lock (%)
Logon (%)
Rx locked and logon time, in percent, for the sampling
interval.
Pos Ok (%) Valid position, in percent of the sampling interval.
VMU Connection (%) Link with VSAT modem, in percent of the sampling
interval.
Blocking (%) Ship in blocking zone, in percent of the sampling
interval.
DualAntenna.mode
DualAntenna.logon_remote (%)
DualAntenna.active (%)
Shows the current mode and the time active and
remote logon.
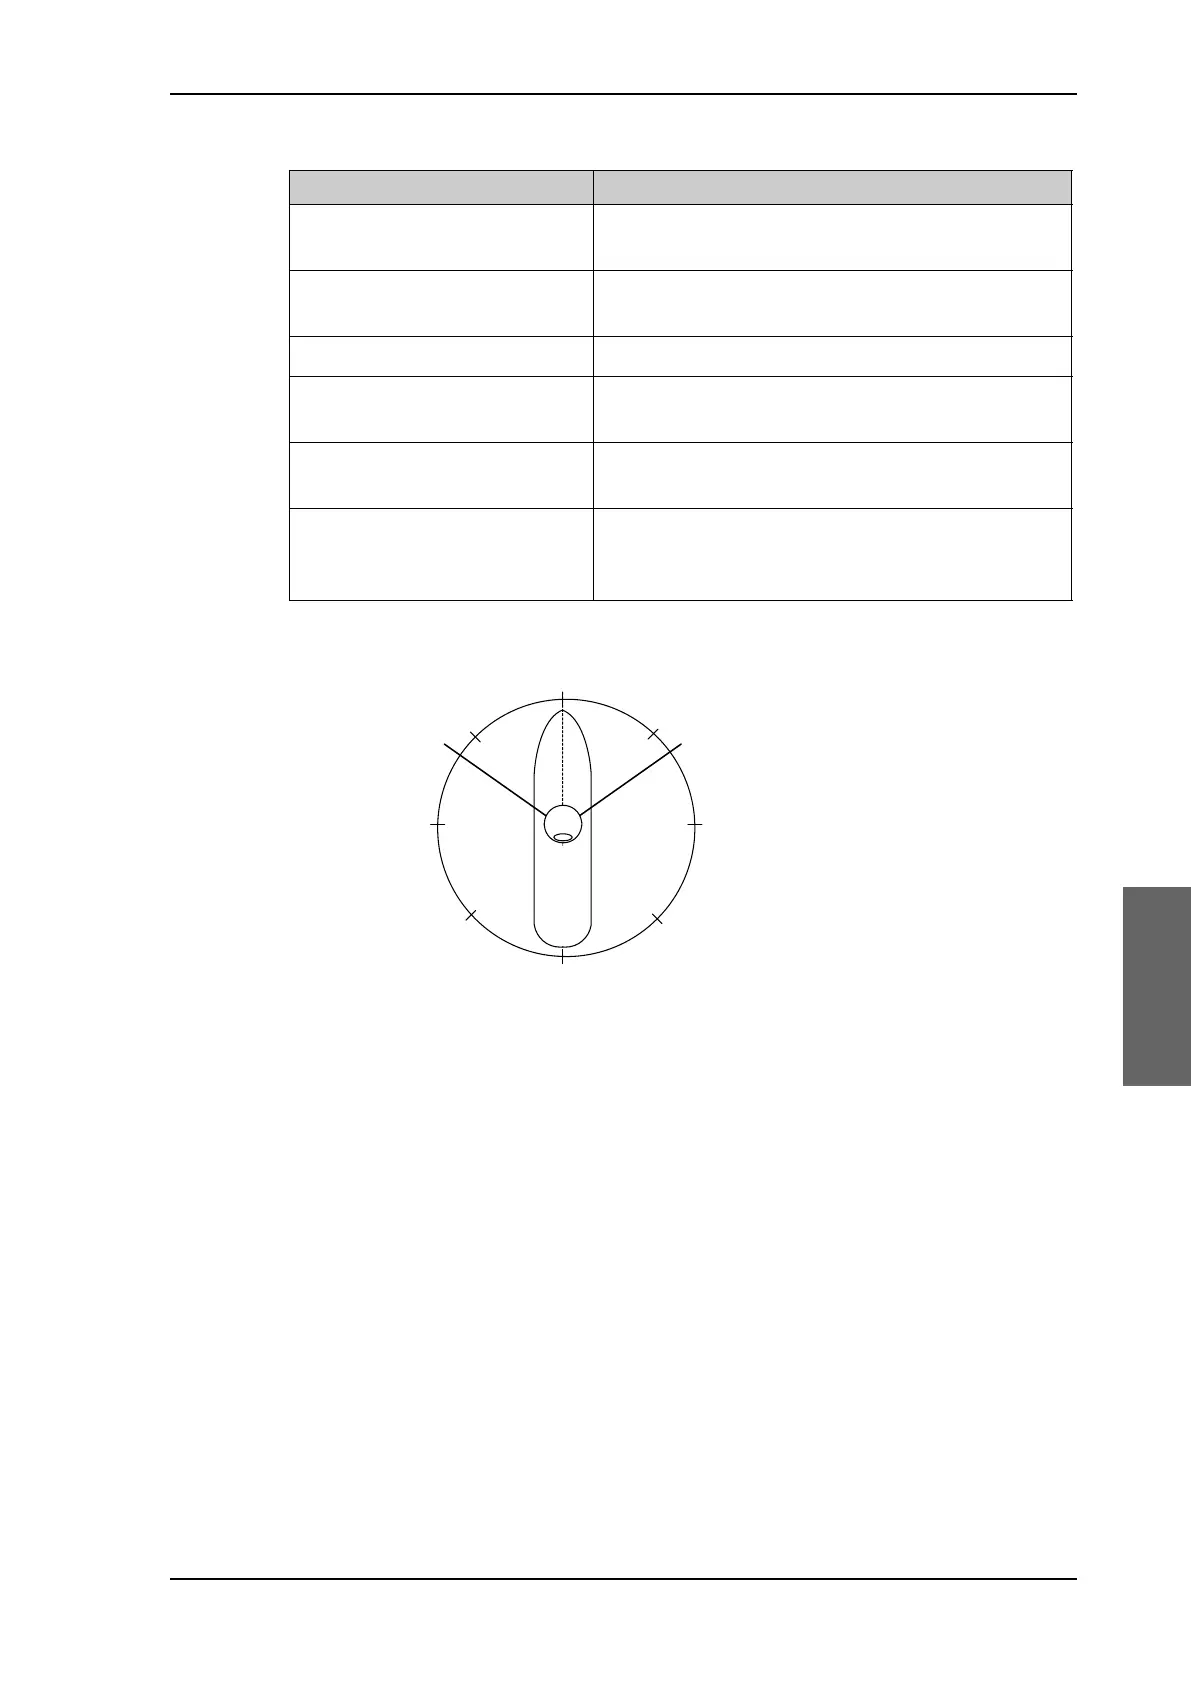
Figure 6-26: Statistics — how to read data for a range
Parameter recorded Description
Table 6-16: Parameters recorded in a statistics report (Continued)
360°
000°
45°
90°
180°
135°225°
270°
315°
Antenna
MaxMin
Covered area:
If range > 0: Go from Min to Max counterclockwise
If range < 0: Go from Min to Max clockwise
SAILOR900HP.book Page 35 Monday, July 18, 2016 12:44 PM