2-4
Displaying RMON
After the above configuration, you can execute the display command in any view to display the RMON
running status, and to verify the configuration.
Table 2-2 Display RMON
Operation Command Description
Display RMON statistics
display rmon statistics [ interface-type
interface-number | unit unit-number ]
Display RMON history
information
display rmon history [ interface-type
interface-number | unit unit-number ]
Display RMON alarm
information
display rmon alarm [ entry-number ]
Display extended RMON alarm
information
display rmon prialarm
[ prialarm-entry-number ]
Display RMON events display rmon event [ event-entry ]
Display RMON event logs display rmon eventlog [ event-entry ]
Available in any
view.
RMON Configuration Examples
Network requirements
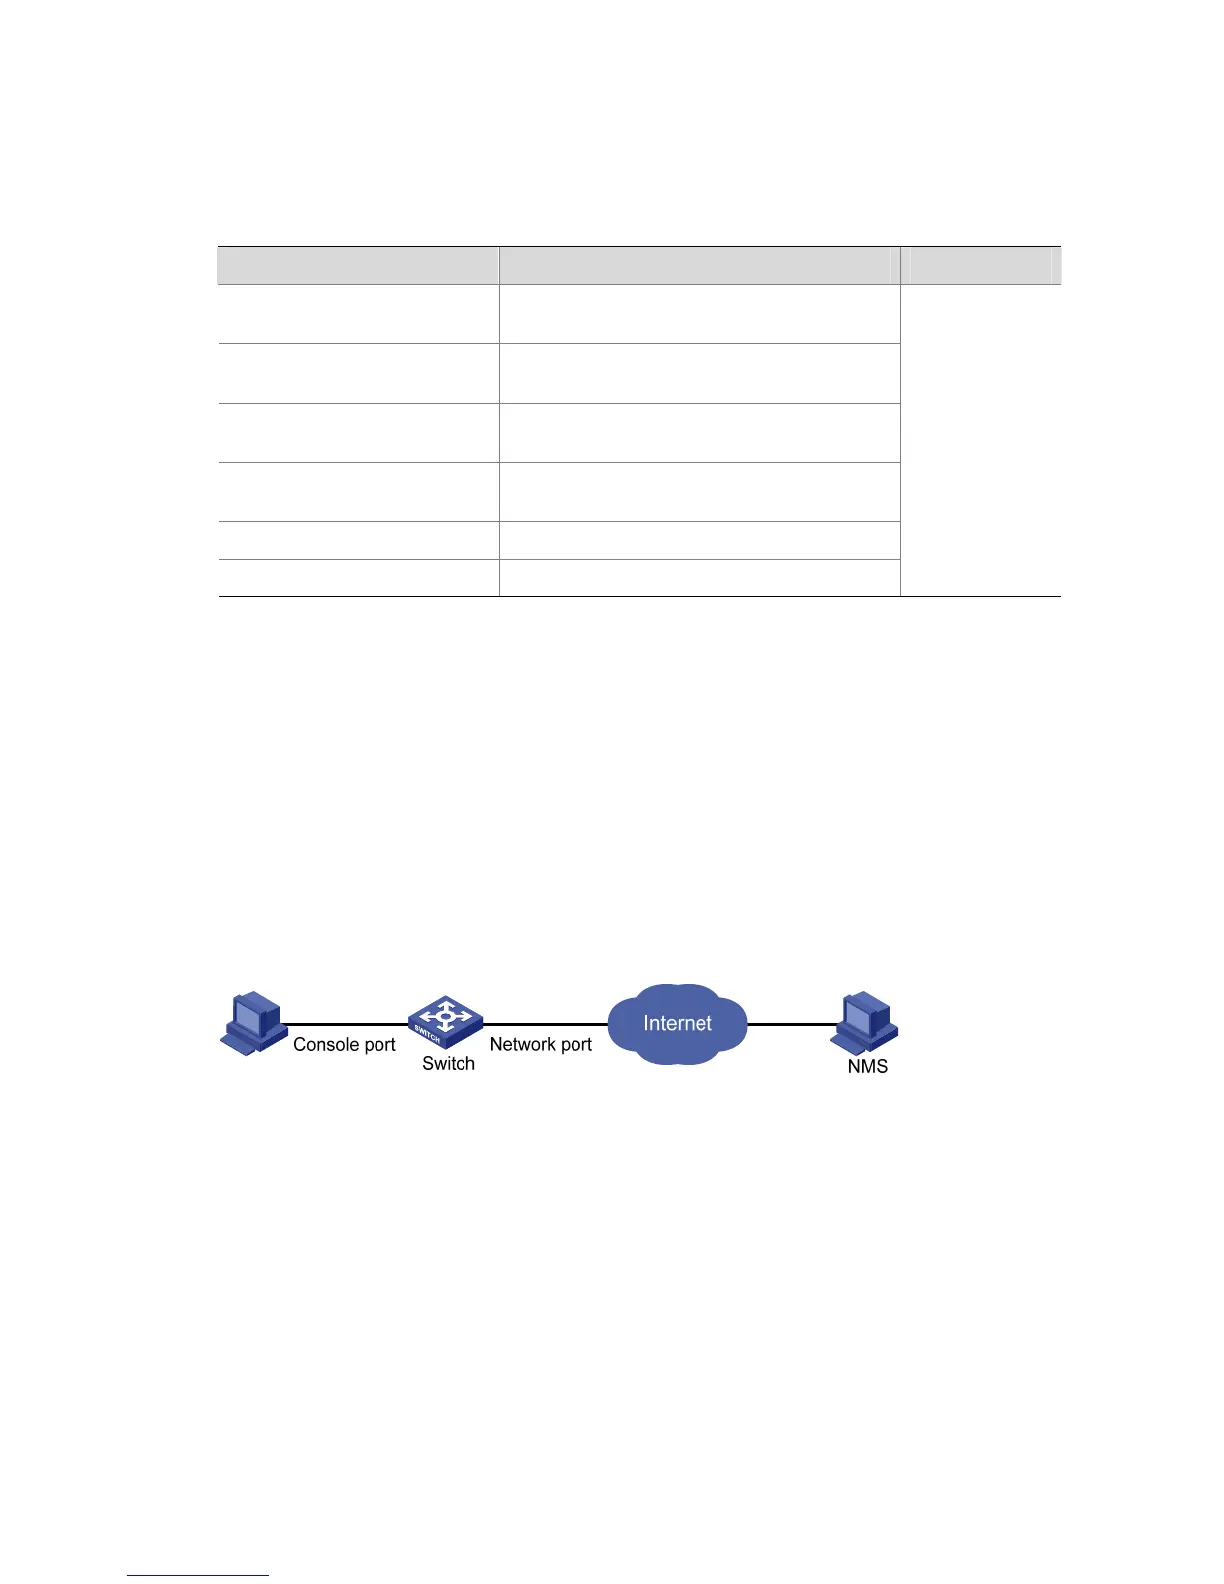
z The switch to be tested is connected to a remote NMS through the Internet. Ensure that the SNMP
agents are correctly configured before performing RMON configuration.
z Create an entry in the extended alarm table to monitor the information of statistics on the Ethernet
port, if the change rate of which exceeds the set threshold, the alarm events will be triggered.
Network diagram
Figure 2-1 Network diagram for RMON configuration
Configuration procedures
# Add the statistics entry numbered 1 to take statistics on Ethernet 1/0/1.
<Sysname> system-view
[Sysname] interface Ethernet 1/0/1
[Sysname-Ethernet1/0/1] rmon statistics 1
[Sysname-Ethernet1/0/1] quit
# Add the event entries numbered 1 and 2 to the event table, which will be triggered by the following
extended alarm.
[Sysname] rmon event 1 log
[Sysname] rmon event 2 trap 10.21.30.55
 Loading...