LABORIE Goby Owner’s Manual GOBY-UM02 46
To display the URA window:
1. Click Info > X-Y plot.
2. Click
. The URA
Plot window will appear. Refer to
Figure
48
.
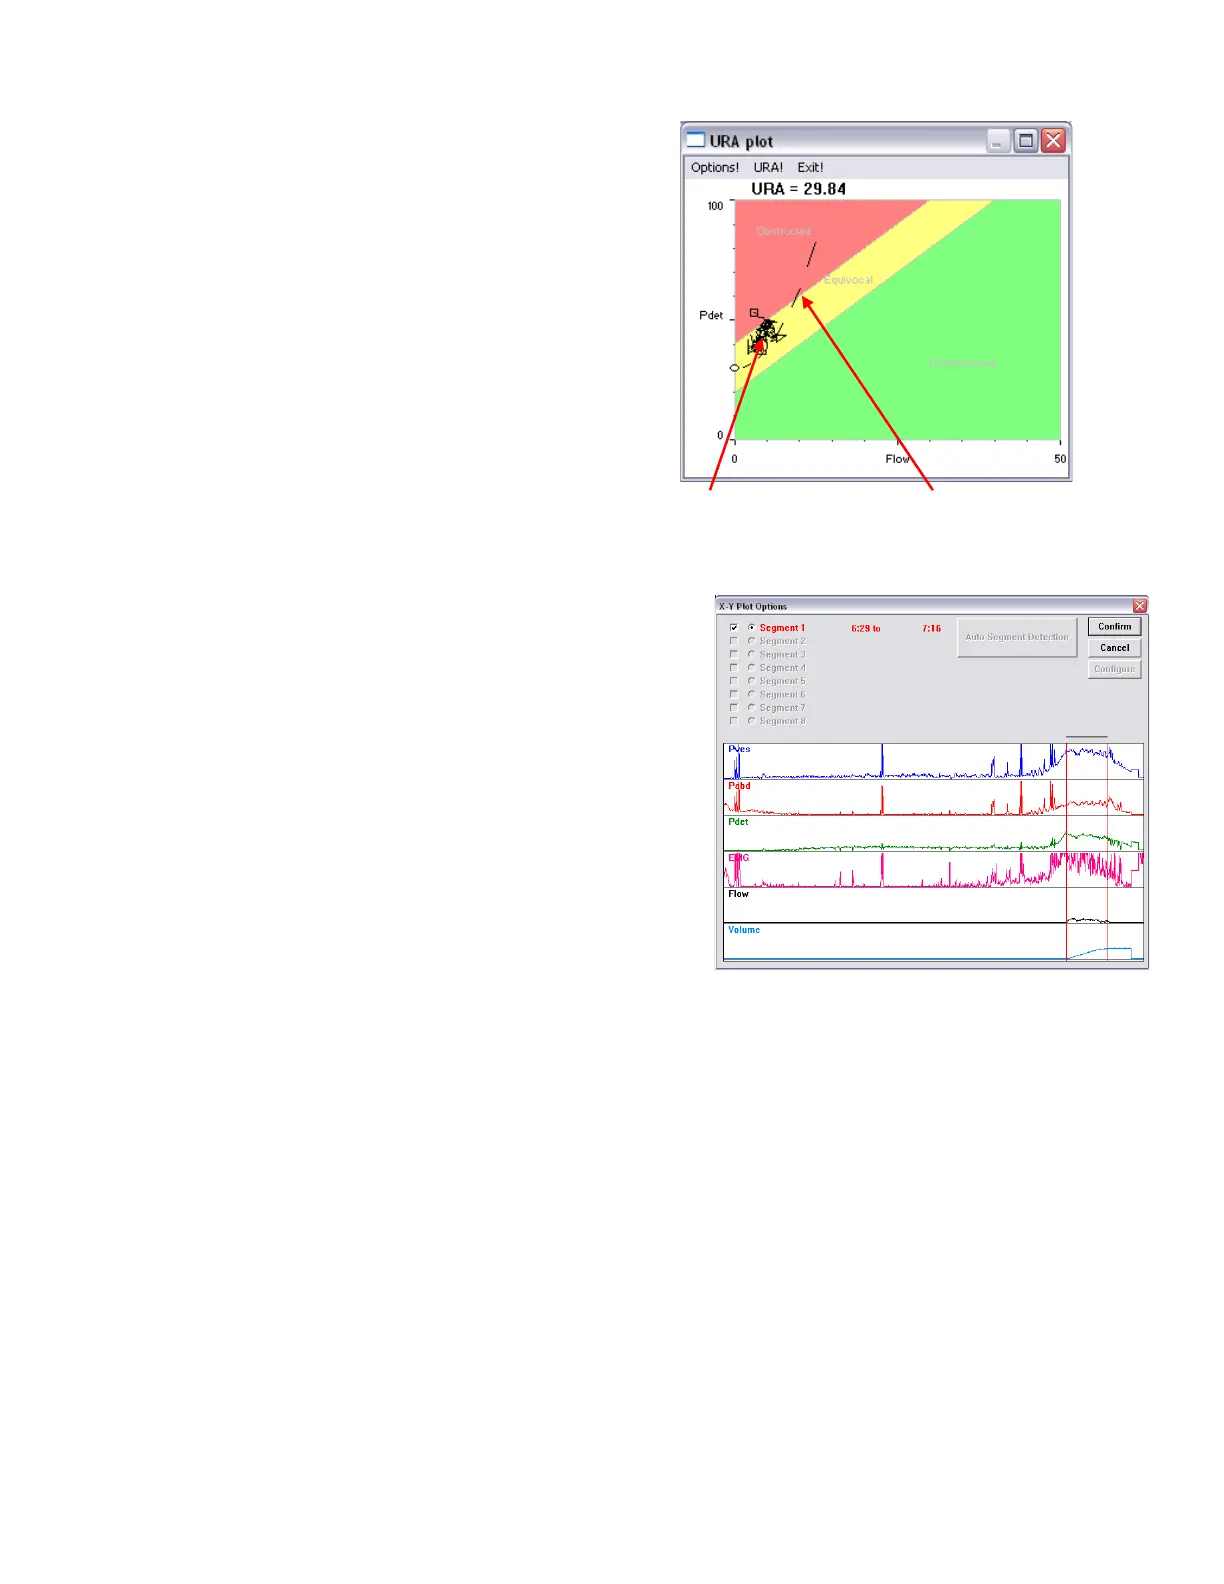
• In the URA plot figure, the solid curve is Flow
vs. Pdet and the dotted curve is URA.
• To cancel the URA option select
in the
URA Plot window.
• To display the URA Curve select
.
Figure 48: URA plot window
To specify the analyzing range:
1. Click Options! from the URA plot window to open
the
window.
2. Click the
button
3. Select the segment analyzing range by dragging the
mouse pointer across the graph from left to right.
4. Click
.
5. Click
.
Refer to Figure 49.
By default, the complete test is plotted on the graph and the scale is
determined by the scale of the channels. This information is
configured in the X-Y Plot options window.
Figure 49: X-Y Plot Options
To change a channel name, threshold, or scale:
1. Click Options! from the URA plot window.
2. Double-click in the text box of the name, threshold, or scale to be changed.
3. Type the appropriate modification.
4. Repeat steps 2 and 3 until all parameter changes are complete.
5. Click OK to exit.