LABORIE Goby Owner’s Manual GOBY-UM02 77
5.8.7 Enable Button Sounds
By default, button sounds and commands are audible in the software. To mute the sounds, click Options > Enable Button
Sounds to deselect the option. Click Options > Enable Button Sounds to turn the sound on again if desired.
5.8.8 Event Display Options
Utilize event display options to customize how events and peaks are marked on the curve.
To change how events and peaks are marked on a curve:
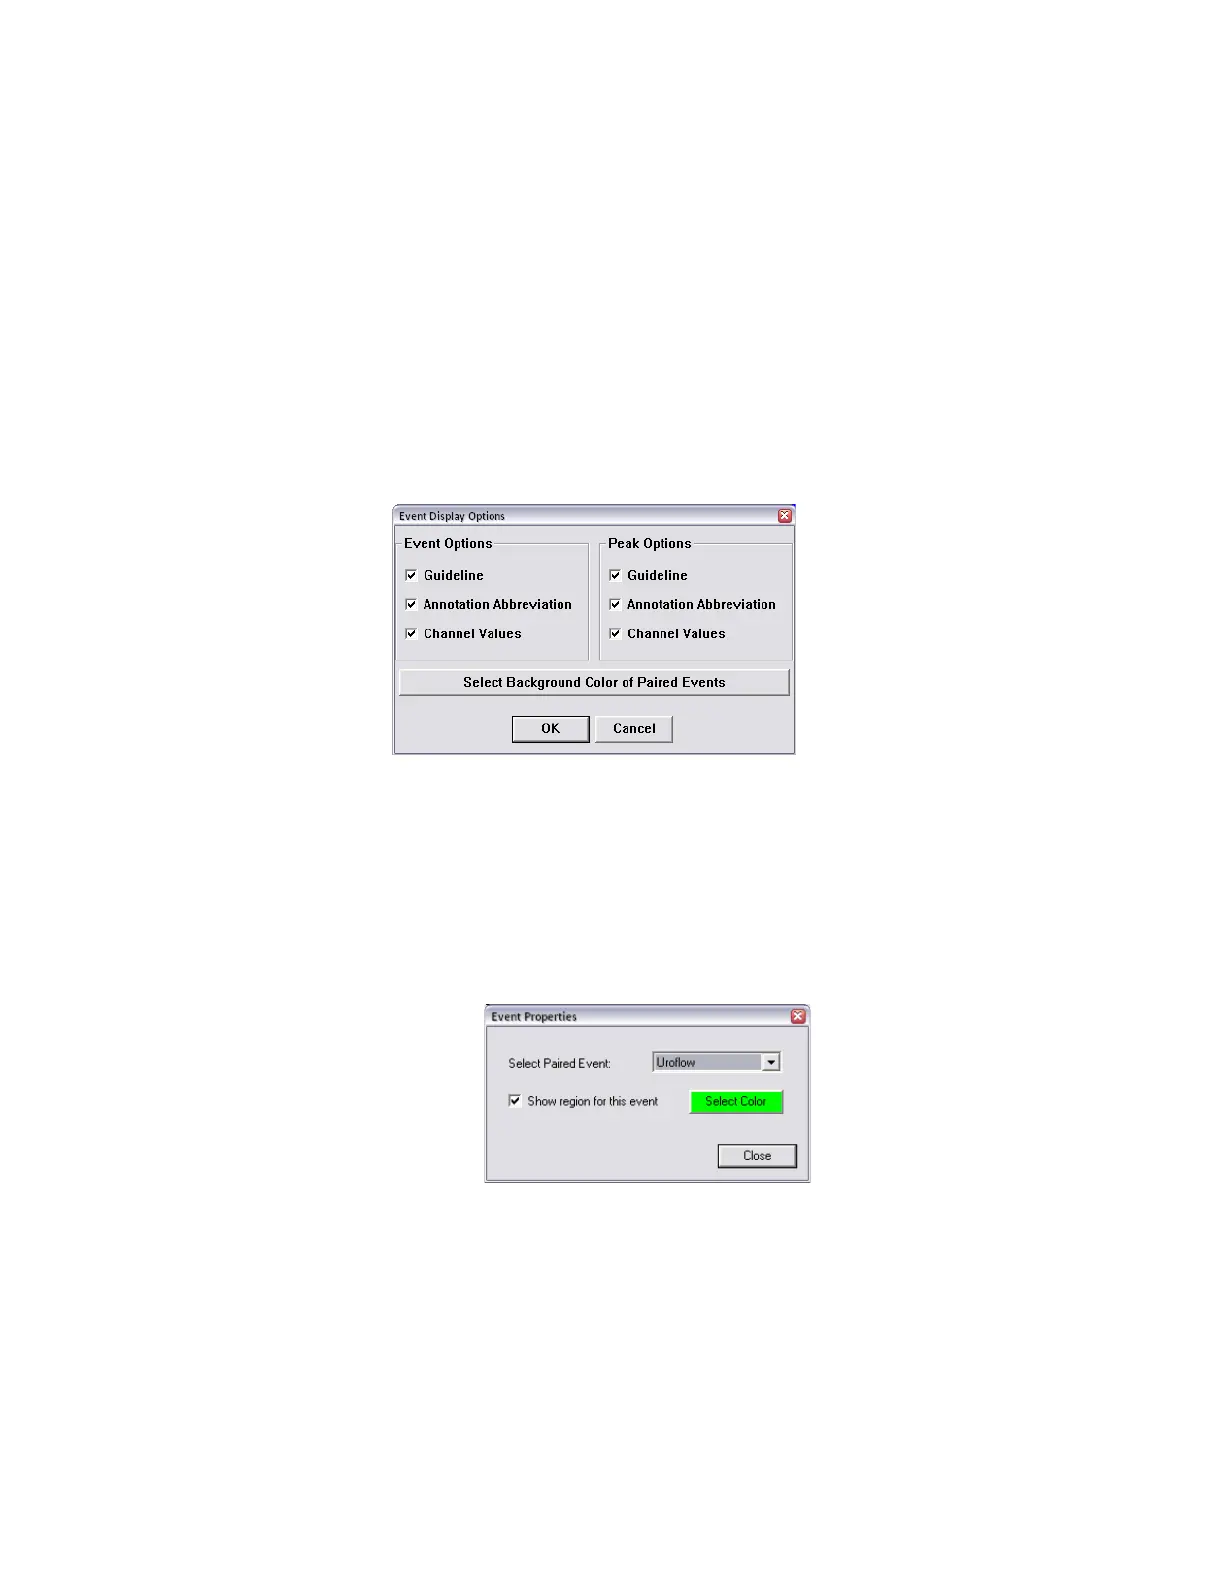
1. Click Options from the menu bar and select Event Display Options.
2. The Event Display Options window will load (Figure 91). Select preferred options and click OK.
The Guideline option displays a dotted line.
The Annotation Abbreviation option displays the first two letters of the Even Annotation.
The Channel Values option displays the value of that event on each channel.
Figure 91: Event Display Options window
5.8.9 Select Background Color for Events
This feature only applies to events configured with auto start and stop. The background of events’ graphic range in the
test selected can be highlighted using the
Select Background Color of Paired Events button available on the Event
Display Options Menu (
Figure 91).
1. Click the Select Background Color of Paired Events button (Figure 91) to open the Event Properties window.
2. In the Select Paired Event dropdown menu, choose the type of test and select Show region for this event (Figure
92).
Figure 92: Event Properties – Select Paired Event
3. Click the Select Color button to open the color selection screen.
4. Select the background color for automatic events in the study.
5. Once the color is selected, click Close to exit Event Properties and then click OK to close the Event Display Options
window. During the next test the graph will display a colored background where the events occur.