Procedures for Testing with the DX Host
120 Baker DX 71-030 User Guide EN V10 www.megger.com
NOTE: These values will show the asymmetry of a rotor on both the upper and lower halves of the sin wave.
The upper half of the sine wave will be a reflection of the lower half sine wave about the x-axis. For that
reasons, all the angles can be reduced by half still provide the same information provided you understand
that you will be looking at only one half of the full sine wave.
During the test, you will see the display grow as you move the rotor to a new position and
execute another test (via PPT button). As the example graphic below shows, the RIC Test screen
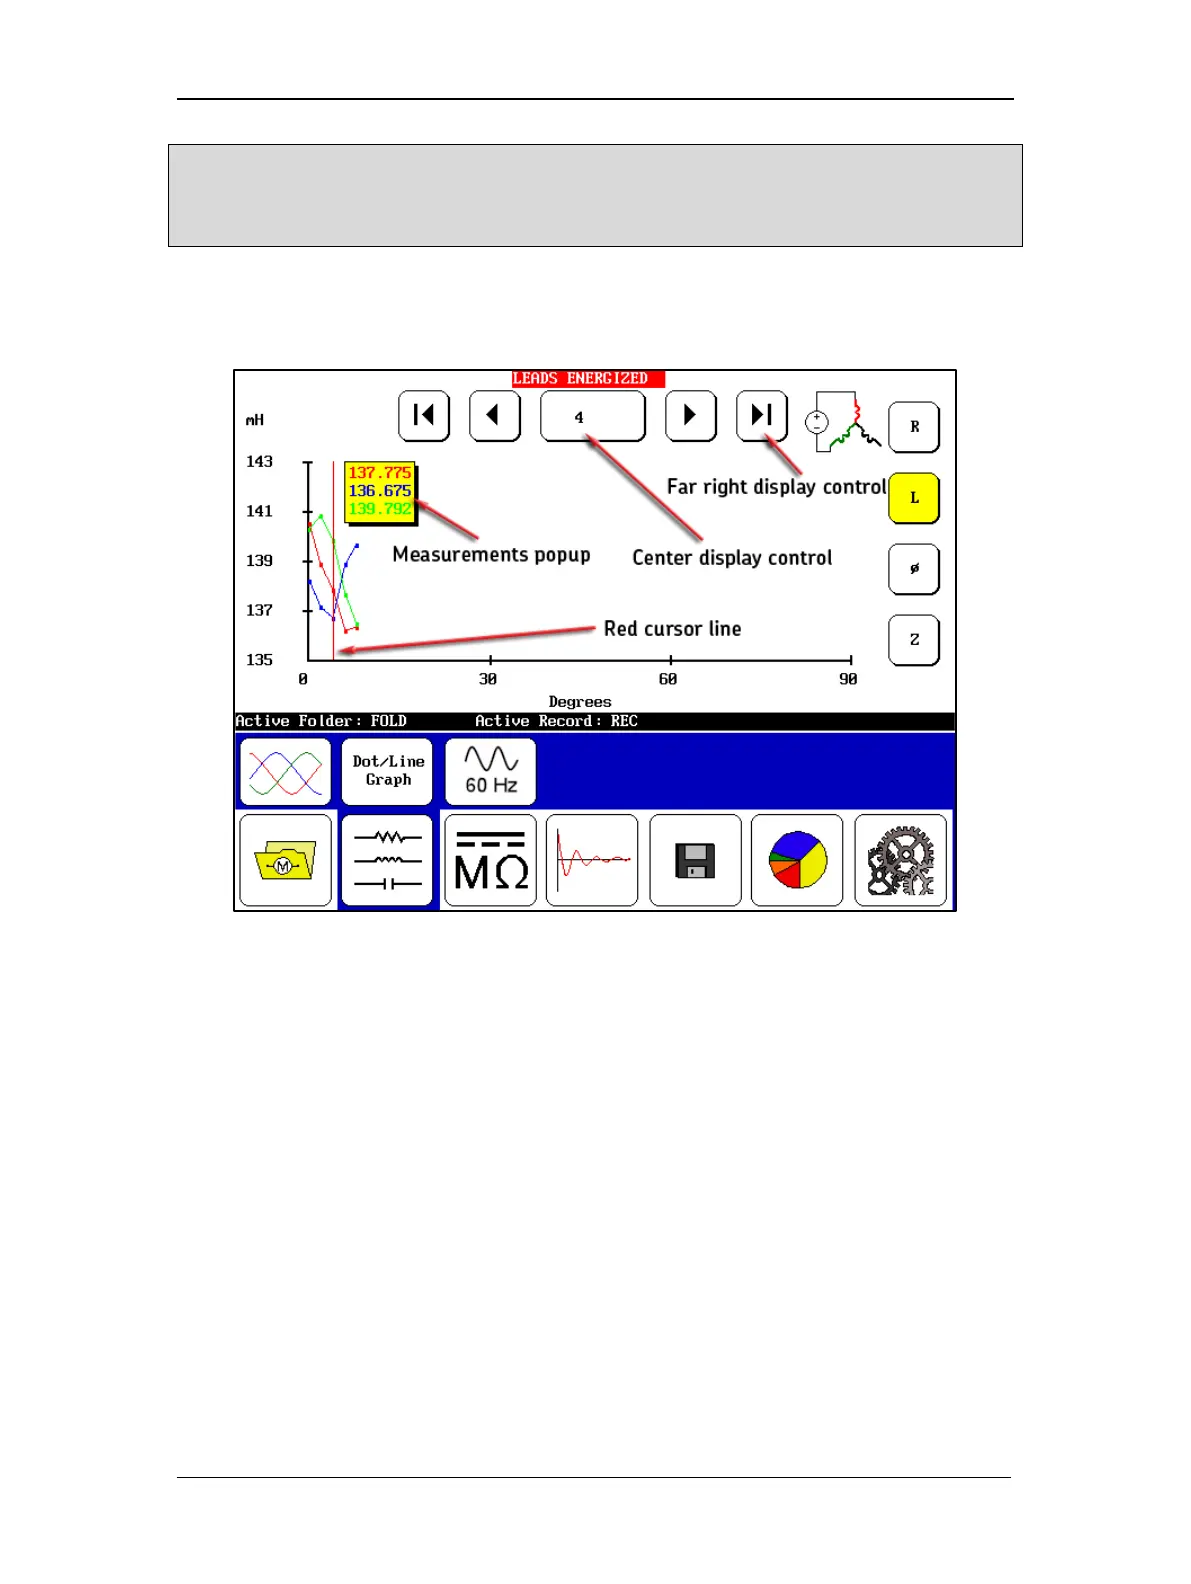
provides you with a number of features to help track and review your progress.
Figure 134. RIC test screen in progress as test data collected.
The center display control indicates the current test position viewed, which is indicated in the
plot by the red cursor line.
The cursor line indicates the position being updated during test, so normally it would be ahead
of the recorded test data as you execute tests in sequence. If you touch the center display
control, you can choose which test position to go to and the cursor will also move to that
position (for example, if you want to view the results of an earlier test).
The far-right display control returns you to one point beyond the last test completed so you can
continue with your testing in the original sequence.
The measurements popup provides you with greater resolution for the selected test than you can
get from viewing the plots on the graph. The measurements are color-coded to correlate with
the graph.
As you select different measurement sets using the control icons on the right edge of the screen
(for AC resistance, inductance, phase angle, and impedance) the Y-axis changes accordingly to
display the proper units for each measurement type and scale.
 Loading...