7 About Reports
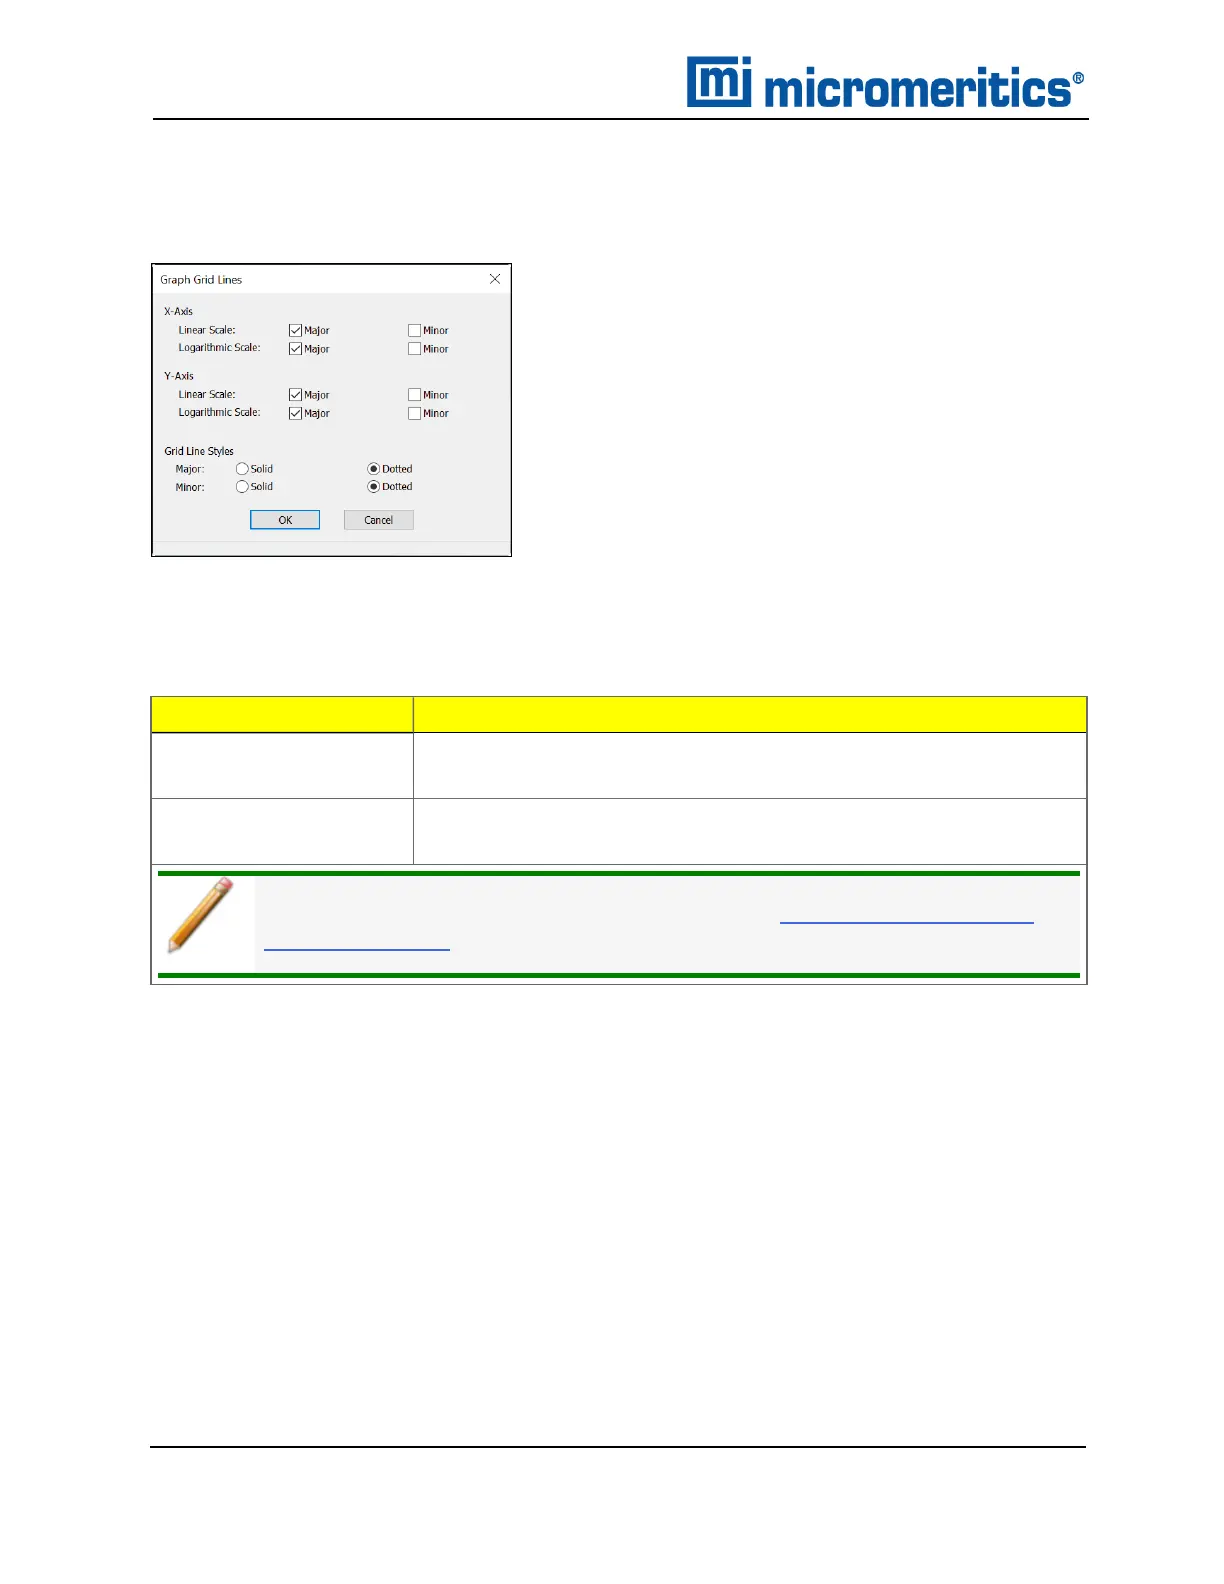
GRAPH GRID LINES
Options > Graph Grid Lines
Use to select how grid lines appear on reports. This menu option is not available if using Restricted
option presentation.
Field or Button
Description
Grid Line Styles
[selection]
Select if the major and/or minor grid lines should appear as solid or dot-
ted lines.
X-Axis / Y-Axis
[selection]
Select major and/or minor lines to display in reports for the logarithmic
and linear scales. Deselect this option to remove the grid lines.
For fields and buttons not listed in this table, see Common Fields and But-
tons on page3 - 2.
Graph Grid Lines
ZOOM FEATURE
Use the zoom feature to examine graph details. Click, hold, and drag the left mouse button on the
graphical area to be enlarged. A box will display in the area to be enlarged. To return to normal view,
right click in the graph and select Autoscale all axes.
7 - 14
AccuPyc II 1345 Operator Manual
134-42851-01 (Rev A) — Jan 2021
 Loading...


