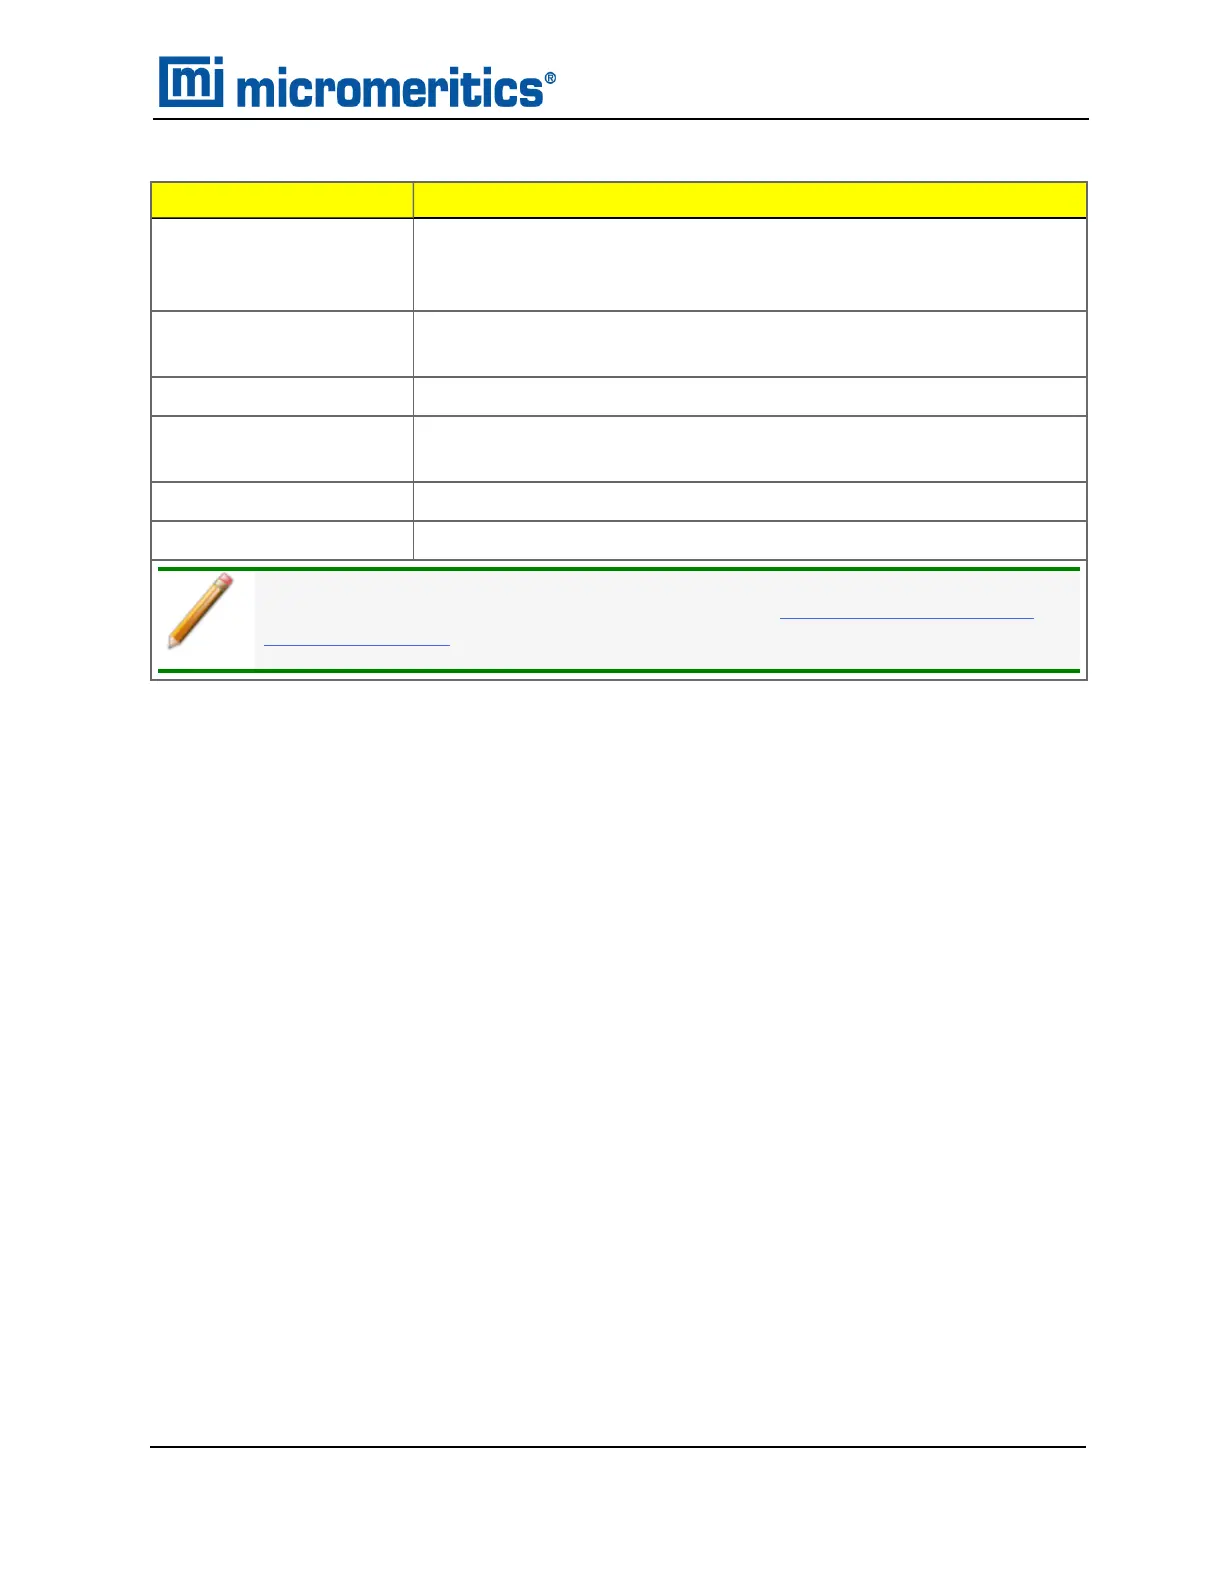
Field or Button
Description
Plot curve
Plot points
[checkbox]
Select to display how data are plotted.
Report quantity
[drop-downbox]
Select a variable to be reported.
Report total of [textbox]
Enter the number of cycles for this report. Enter up to 8 cycles.
Report every
[textbox]
Enter time between points. Up to 60 seconds can be entered.
Show plot [checkbox]
Generates a plot (graph) for the Report quantity field selection.
Show table [checkbox]
Generates a tabular report for the Report quantity field selection.
For fields and buttons not listed in this table, see Common Fields and But-
tons on page3 - 2.
Equilibration Report (continued)
Equilibration Report
AccuPyc II 1345 Operator Manual
134-42851-01 (Rev A) — Jan 2021
8 - 7
 Loading...


