Chapter 5 Web-Based Operations
78 Lynx II DSA User's Manual - 7096089
The spectrum is drawn using the plot style defined by the “Plot Type” preference. There
are three styles.
• Line – This style connects each data point using a line.
• Scatter – Draws individual spectral data points.
• Area – This style draws bin-centered bars for each channel.
The x-axis units are defined by the “X-Units” preference. There are options for displaying
channel, energy, or custom units. The number of ticks and tick labels follow industry
conventions for gamma spectroscopy.
The y-axis scale is defined by the “Y-Scale” preference. There are options for logarithm,
linear, and square root. The number of ticks and tick labels follow industry conventions
for gamma spectroscopy.
The plot will automatically update when new data is available. The update rate is
determined by the “Refresh Rate” preference.
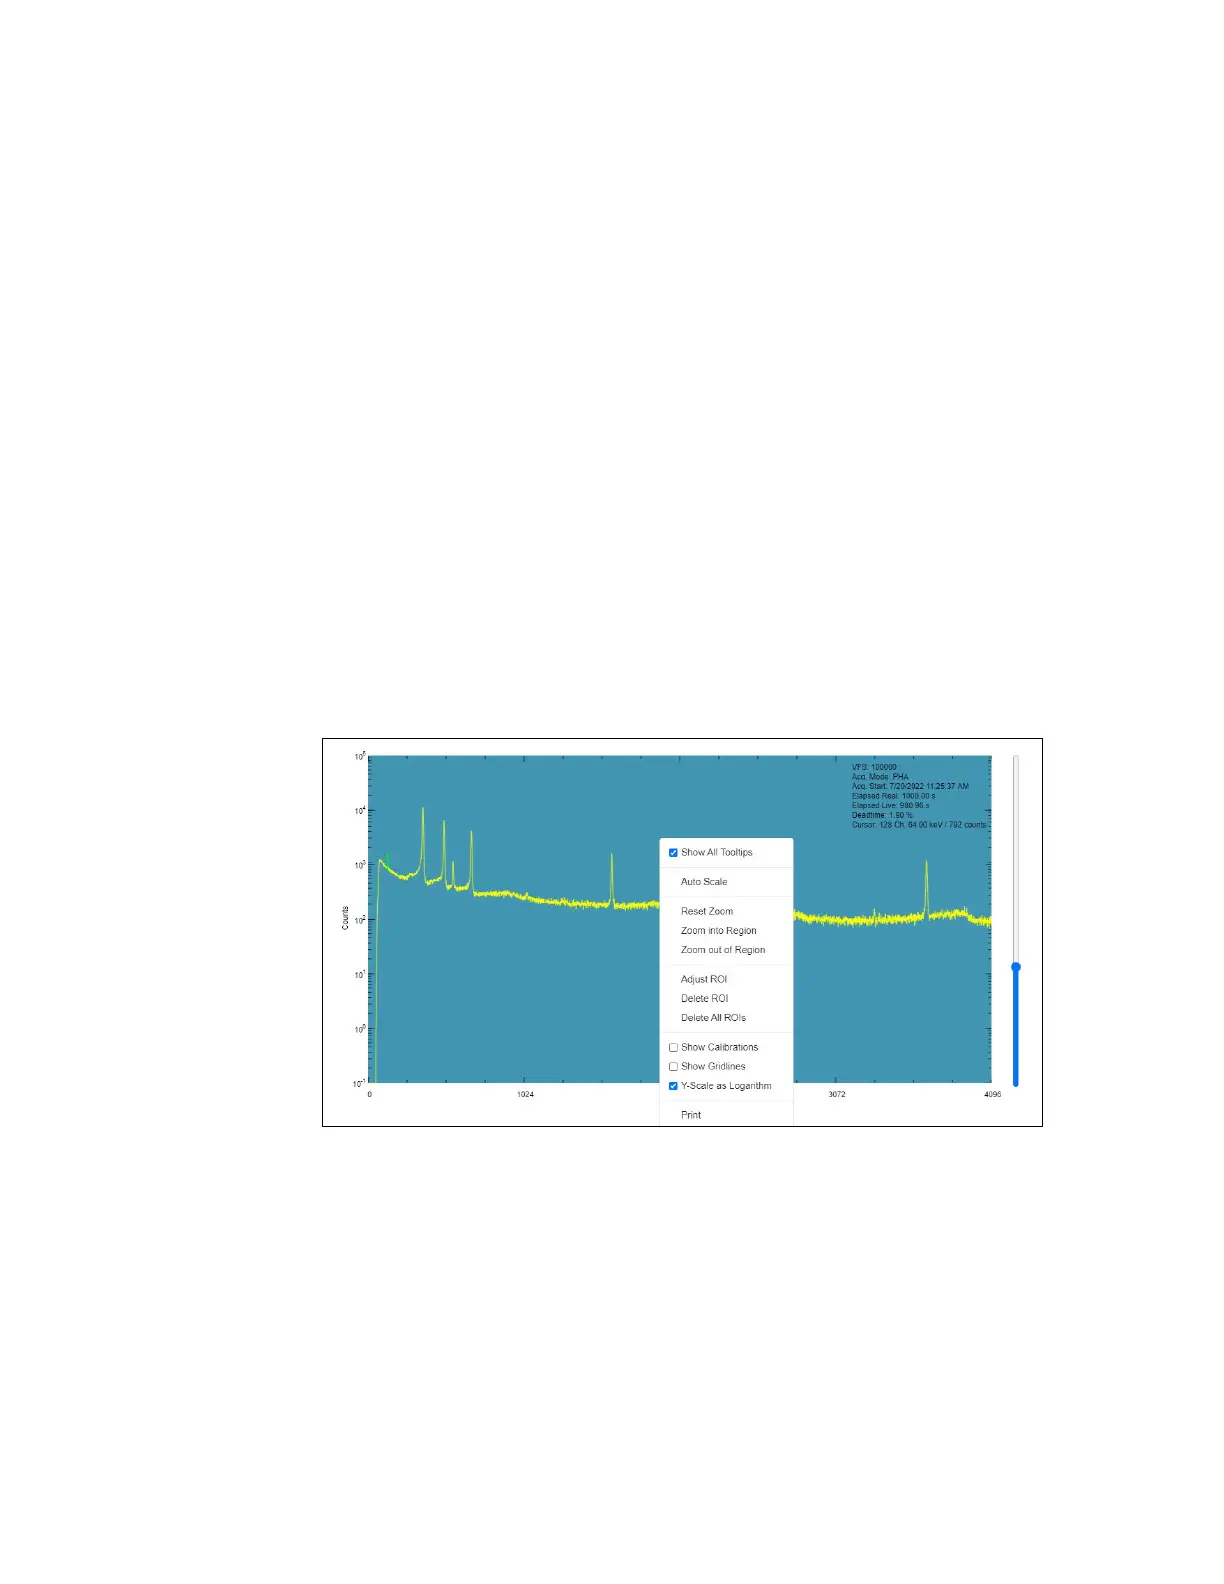
Spectral Plot Context Menu
Right-click on the spectral plot displays the following context menu. This menu displays
the following options, as described from top to bottom.
Figure 42: Context Menu for the Spectral Plot
This menu displays the following options, as described from top to bottom.
• Show All Tooltips – When selected, displays the items listed below in the tooltip
section of the spectral display. See “Show All Tooltips” on page 79.
• Auto Scale will re-enable the y-axis auto-scaling option.
• Reset Zoom – Undoes zoom and automatically scales the x-axis.
 Loading...