Overview of the Lynx II Web Client User Interface
Lynx II DSA User's Manual – 7096089 77
Pressing “Stop” while in MSS acquisition mode, the Web Client application will request
whether to stop immediately by aborting the acquisition cycle or wait until the end of the
current cycle as dictated by the pre-programmed preset condition(s).
Progress Bar
The progress bar displays the acquisition progress. The information that is displayed is
dependent on the preset option and acquisition mode. The percent complete rules are as
follows:
• If computational presets are enabled and time presets are disabled, the progress bar
will indicate the percent completed, and the progress value will display the current
elapsed computational value.
• If the time or sweeps presets are enabled, the progress bar will indicate percent
complete and the progress value will display the current elapsed value.
• If no preset condition has been set the progress bar will not be filled-in and the
percent complete will indicate 0.0%.
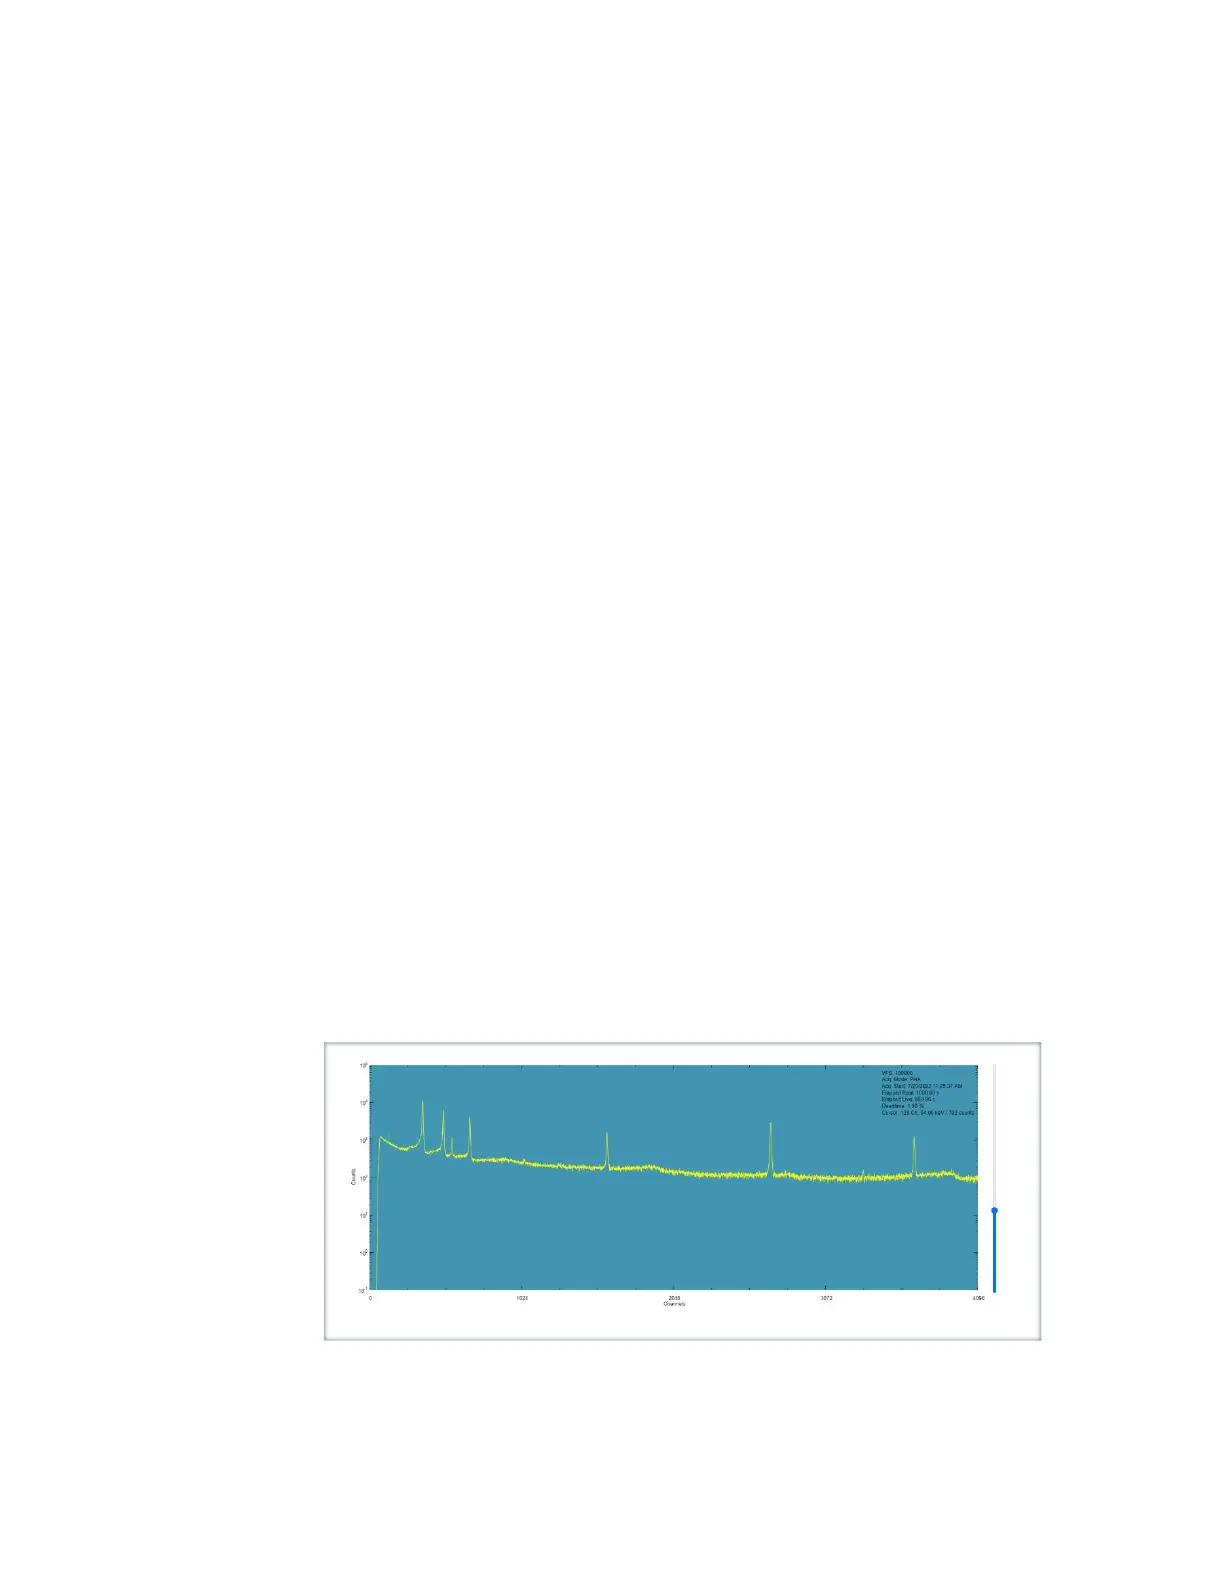
Spectral Plot
The spectrum data plot is the default display when the Web Client application is first
invoked. The plot consists of an XY graph with counts on the Y-axis and channel number
or energy on the X-axis.
This plot is fully interactive. As you move the mouse over the plot the peak selection
cursor will follow. Note you can disable this option by clearing the “Cursor follows
mouse” preference. The current cursor location, along with the number of counts in the
current cursor location channel, is displayed in the tooltip, upper right corner of the plot.
Graphics properties such as colors, plot type, units, etc. for the plot can be changed
through the Navigator’s Preferences settings.
The data from the spectrum plot is based on the current Input selection. The Information
tab displays information about the data being graphed.
 Loading...