Overview of the Lynx II Web Client User Interface
Lynx II DSA User's Manual – 7096089 83
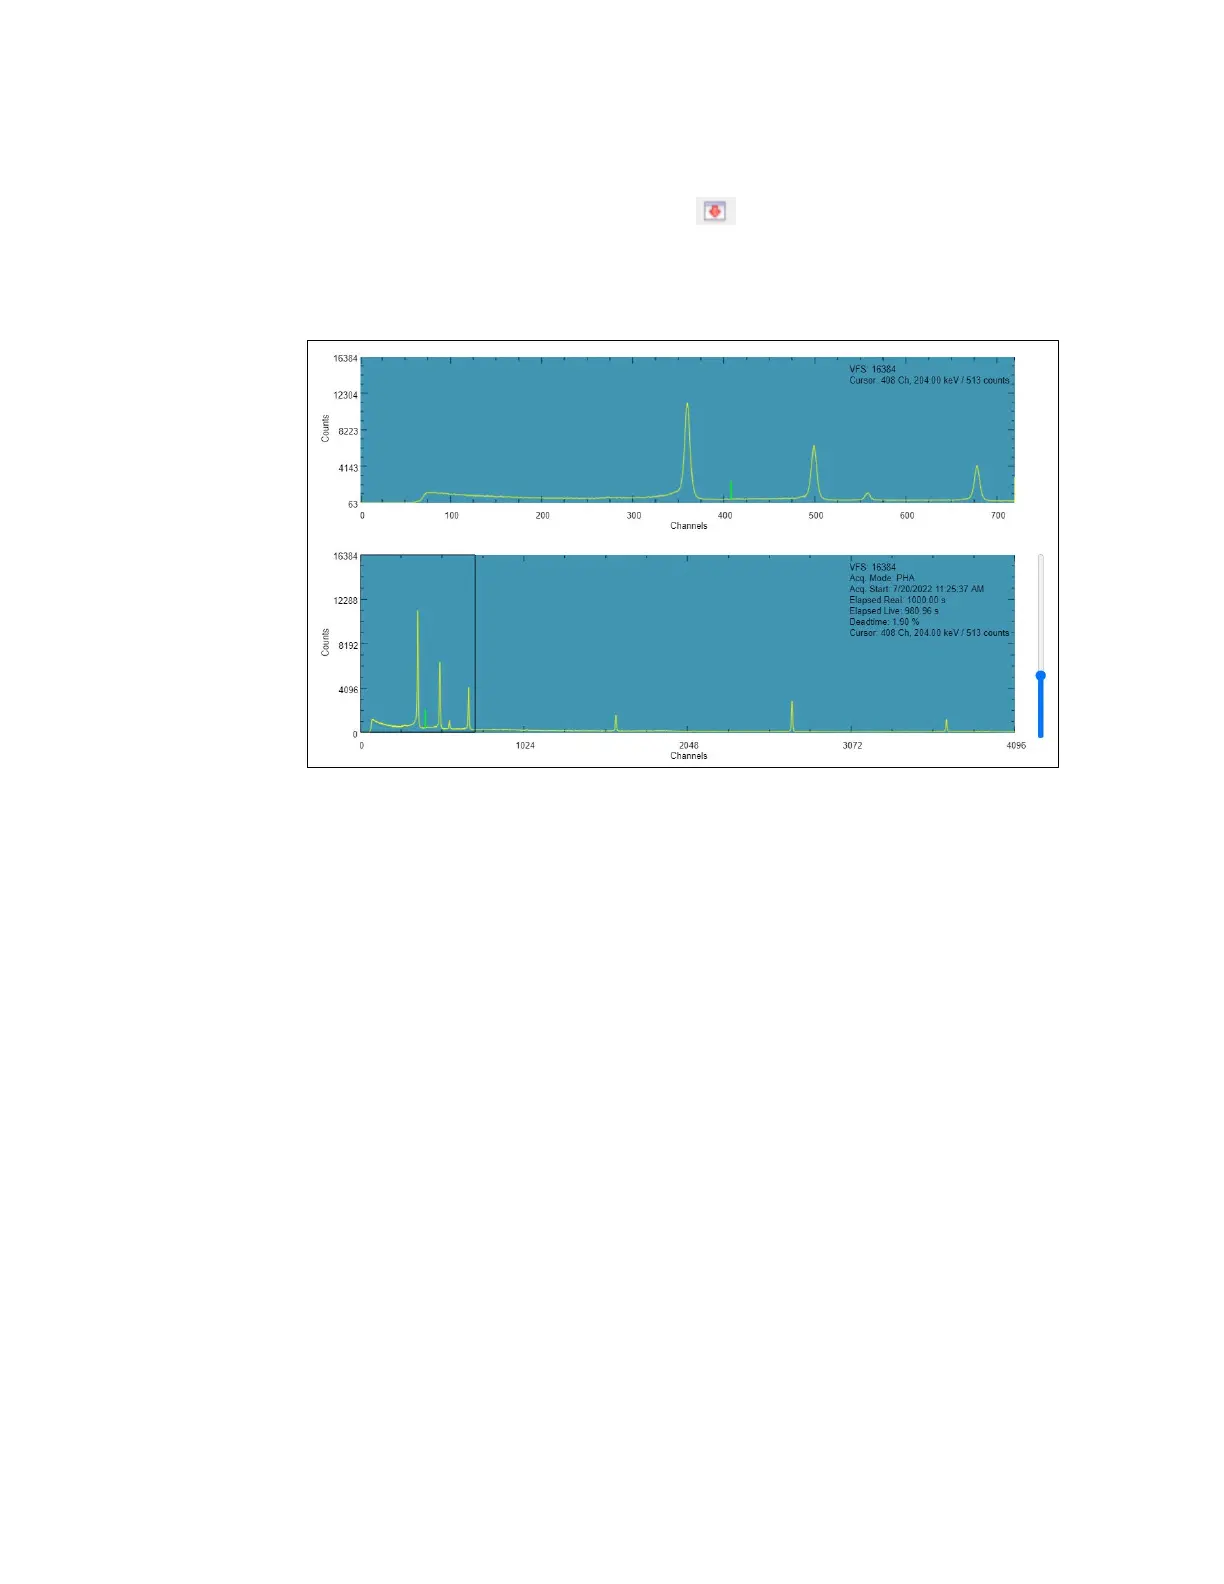
Expanding Plot and Zooming
The icon at the right of the Acquisition Panel., , is used to expand the plot to show a
split-screen display, with the whole spectrum in the lower half of the display and the
expanded portion in the upper half. The expanded plot contains a zoomed-in view of the
spectral plot below.
Figure 43: A Typical Expanded Display
The expanded half of the display is the data inside the rectangle in the lower half of the
display.
The focus of the expanded display, the rectangle, can be moved through the spectrum by
putting the hand icon inside the rectangle, then clicking and dragging it to a new location.
The data shown in the expanded half of the display will track the moving rectangle.
The rectangle can be resized by moving the hand icon to any side of the rectangle. When it
changes color, you can move the hand icon and drag the rectangle’s side to a new height
or width.
Changing the height of the rectangle will automatically rescale the expanded display to
accommodate the data in the rectangle. The normal (unexpanded) display’s VFS will not
change.
Note: The color of the cursor within the expanded box is determined by Preferences |
Miscellaneous | Cursor Color.
The other option is to use the mouse wheel to zoom in and out. Place the peak selection
cursor at a point you want to zoom into. Rotate the mouse wheel up to zoom in. Rotate the
wheel down to zoom out. The horizontal scroll bar on the x-axis lets you pan to the left or
right. The context menu also provides zoom features. Both the expand and zoom options
can be used in combination.
 Loading...