Chapter 5 Web-Based Operations
82 Lynx II DSA User's Manual - 7096089
Click on OK to make changes to any of the parameters displayed in this dialog. The plot
will automatically redraw. ROI quantities displayed in the tooltip are immediately
recalculated.
Deleting an ROI can be done by one of two methods:
1. Right-click the mouse while in an ROI. A context menu will display delete options.
2. Press the delete or backspace key while the peak cursor is in an ROI.
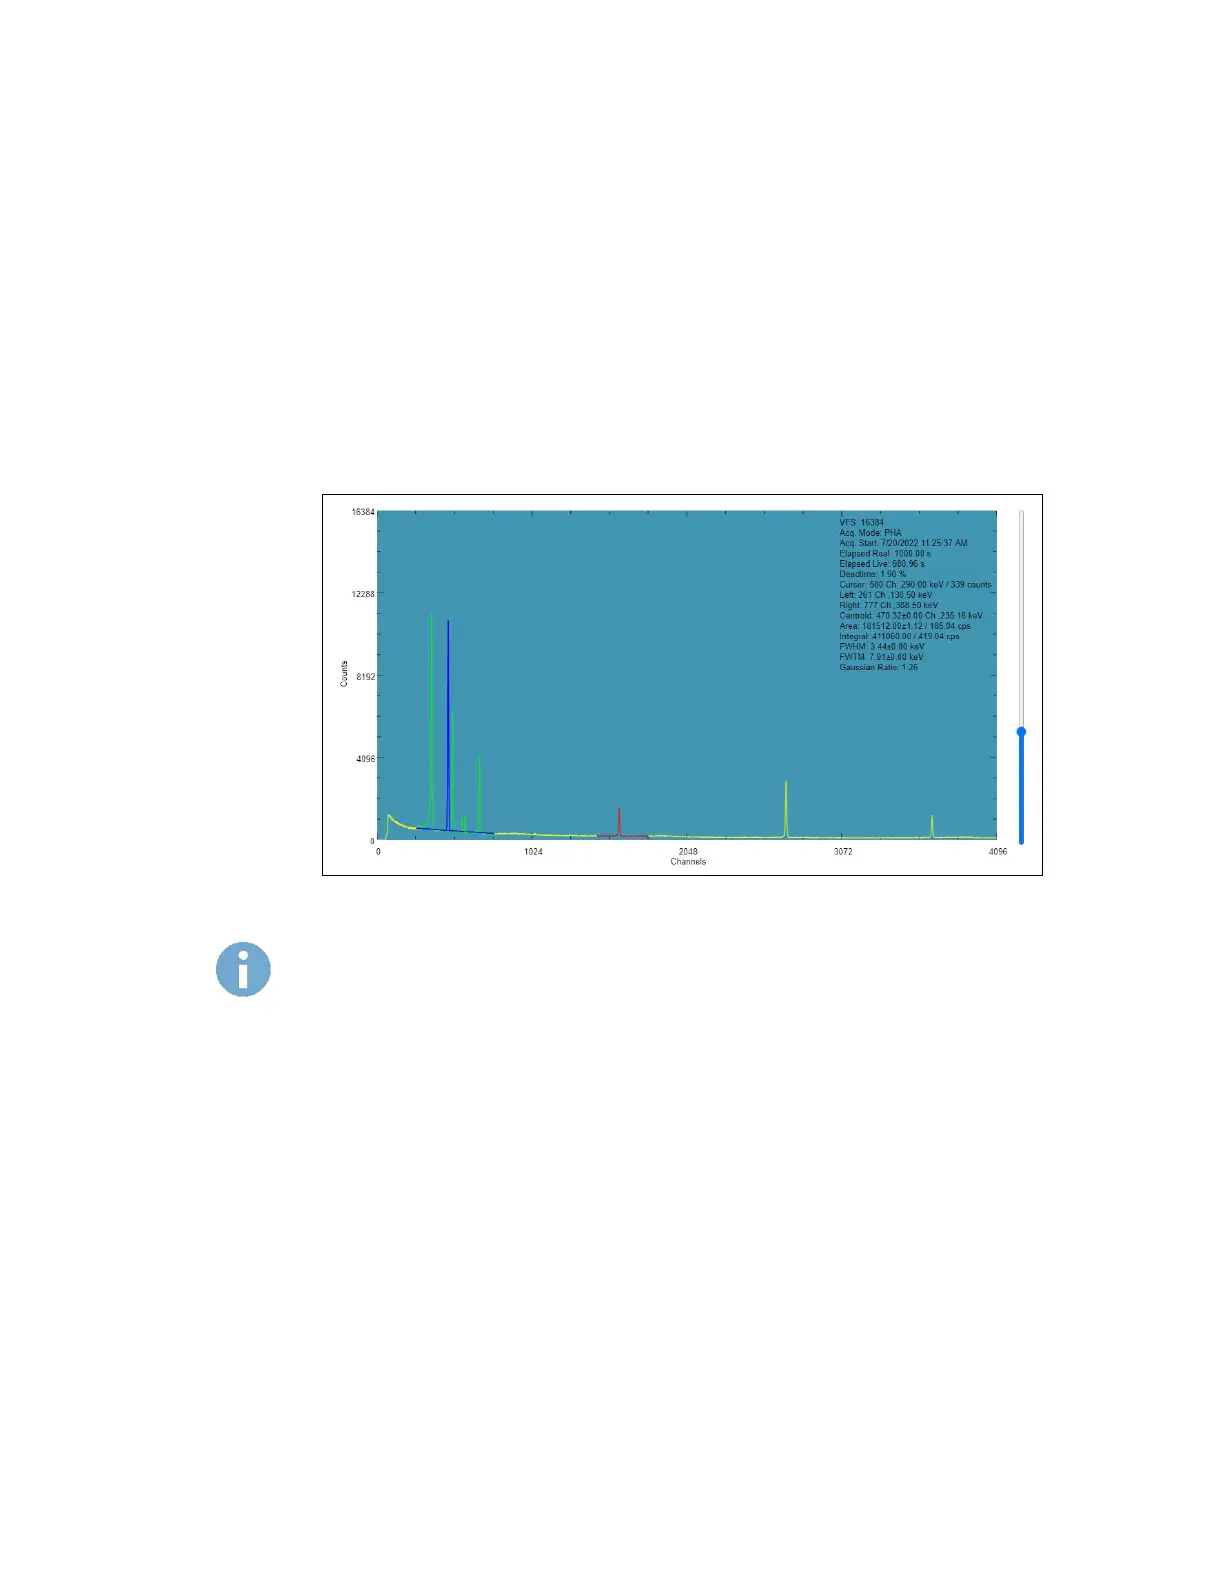
You can create multiple ROIs on a spectrum. Moving the peak selection cursor into each
region will change the region color to indicate it has focus. The figure below shows the
ROI in green to indicate it has focus.
Regions are not stored when the connection to the device is read-only
(unlocked). Therefore, when the browser is restarted or refreshed all regions
are lost
 Loading...