Chapter 7
Using Pipeline Control
124
March, 2009
USING THE DIAGNOSTICS PANEL
To display the diagnostics panel in Mac OS X, select Window > Show Diagnostics Panel. On Windows,
select View > View Diagnostics Panel (only when connected to a Pipeline).
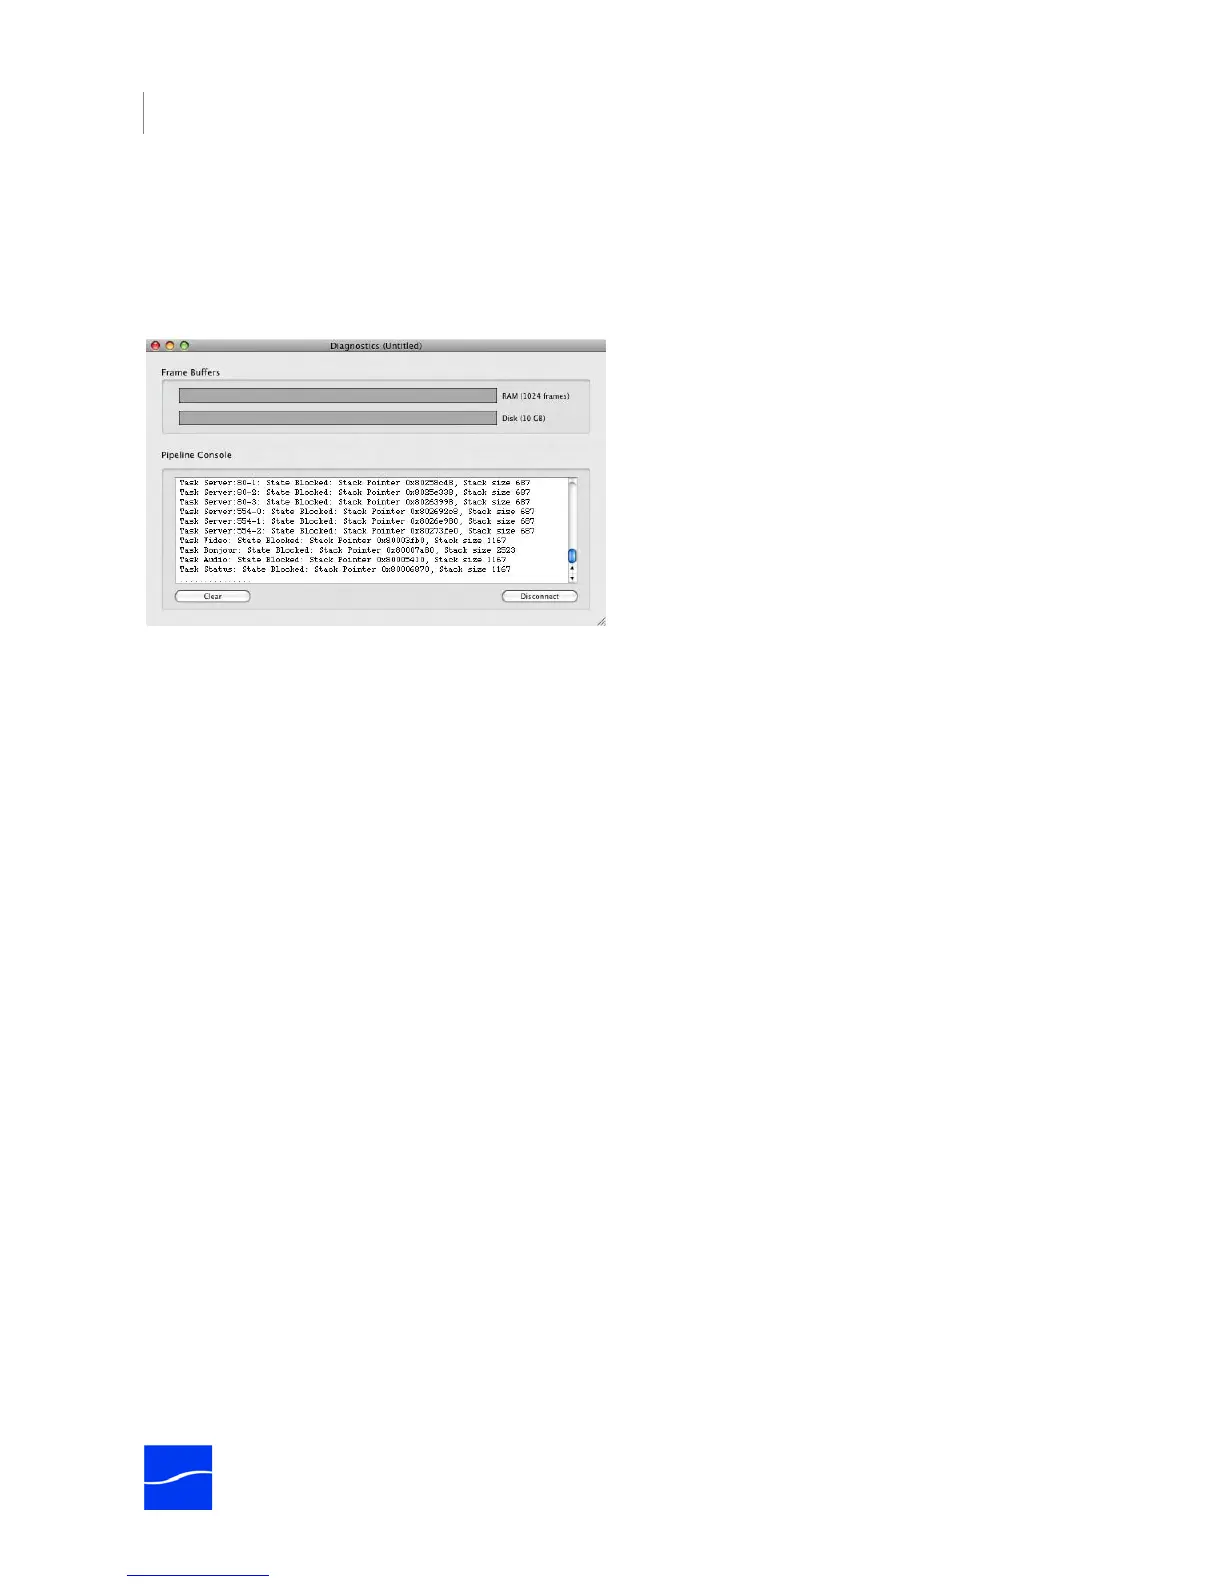
Figure 7–27. Diagnostics window to provide advanced information about the Pipeline.
The diagnostics panel is for advanced users to aid in trouble shooting and technical support. When
connected to a Pipeline the panel displays the current state of the RAM and Disk Frame buffers.
The RAM meter displays the percentage of the frame buffer that is currently full, as well as a high-water
mark that displays the largest size the buffer has been in the last five seconds. If the meter displays red, it
means that Pipeline Control is close to overflowing this buffer, which will cause the current operation to
abort. If the disk buffering feature is enabled, the DISK meter displays how much data is remaining to be
transferred to its final destination (see Disk Buffering, below)
In addition the panel can display the Telnet 911 output being generated by the Pipeline. This information
can be used to diagnose issues if required.