The Monitor Log Chapter 9
WinLink™ 1000 User Manual Release 1.9 9-10
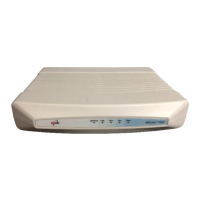
Figure 9-12: Basic Performance Monitoring Report
2. Choose a report type from the left panel and click the Get Data toolbar
button. For example, if you choose Site A, Air and Current, you will be
offered a report looking like this:
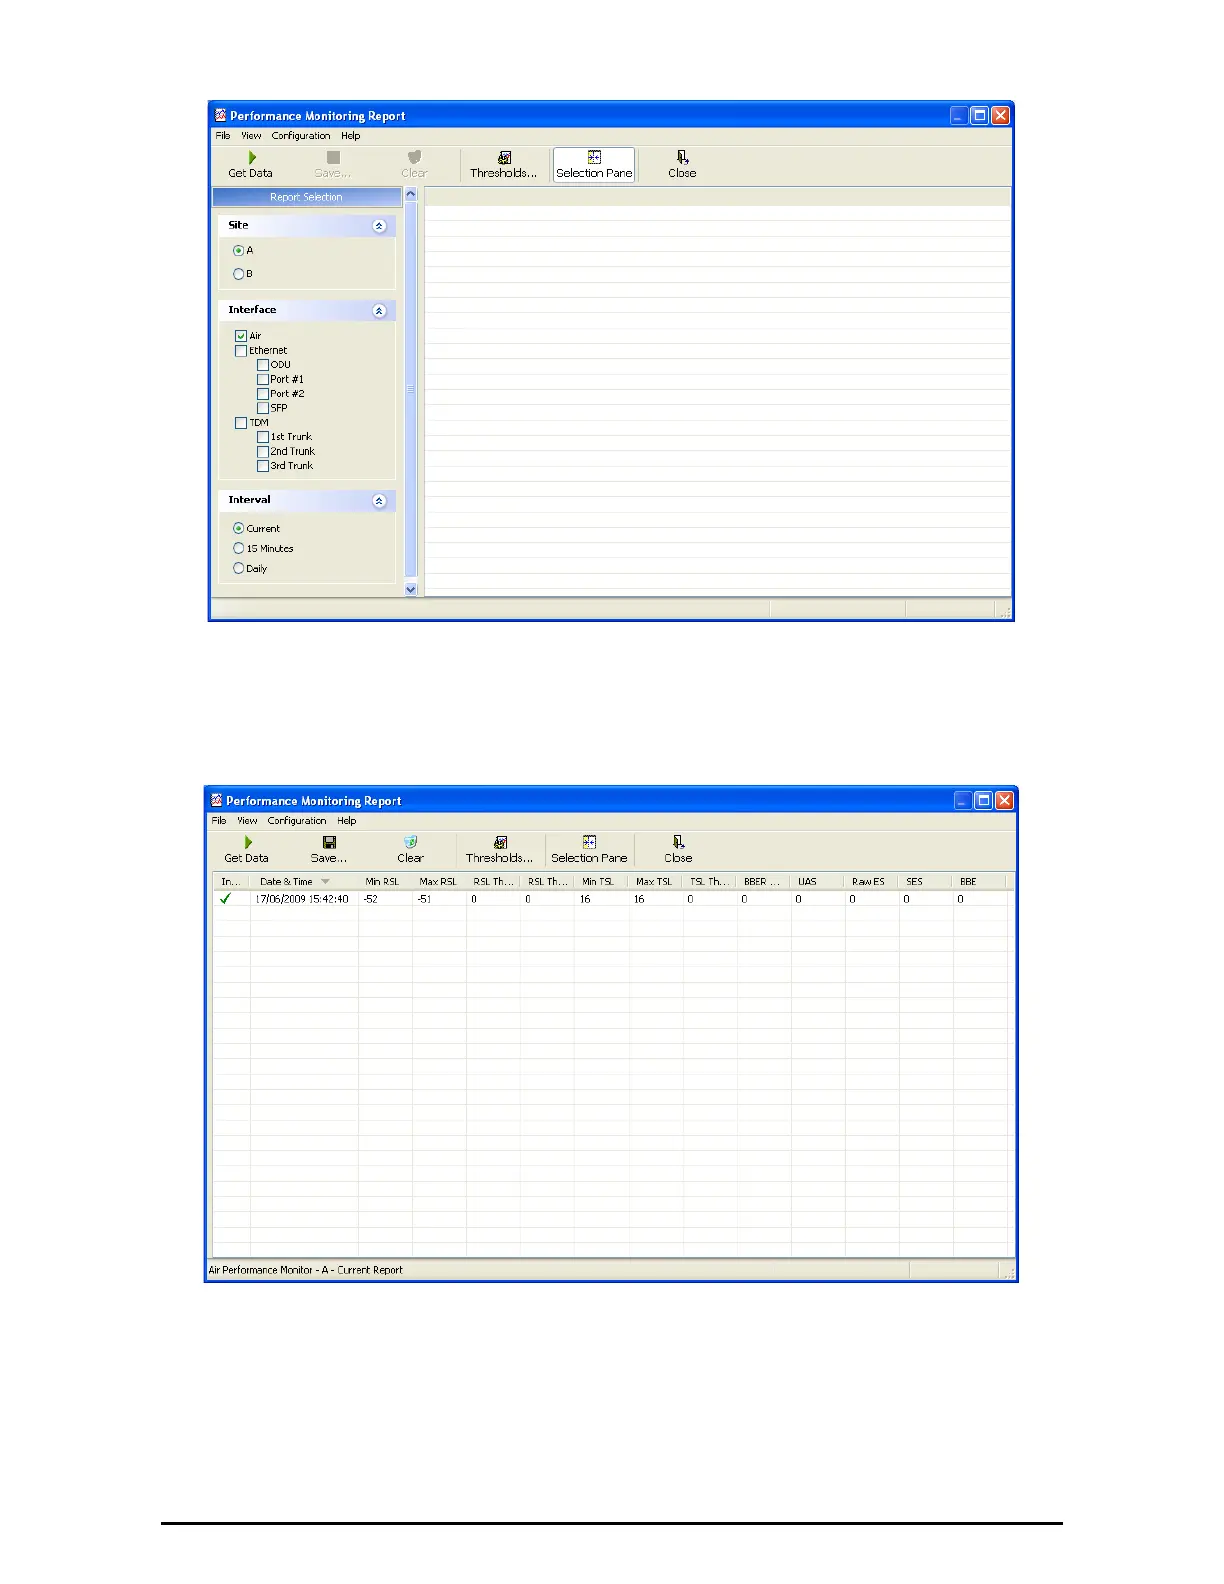
Figure 9-13: A typical Performance Monitoring Report
You can click the Selection Pane icon to toggle the side panel on or off.
The other reports look similar. Here is a detailed description of the reports
and their fields:
Several performance data occurrences are collected for each of the inter-
faces (ES, SES, and UAS), as well as specific data per Interface type (e.g.,
 Loading...