6
"Program" operating area 01/2008
6.7 Free contour programming
6
©Siemens AG 2008 All rights reserved.
6-298 SINUMERIK 840Di sl/840D sl/840D Operating Manual HMI-Advanced (BAD) - 01/2008 Edition
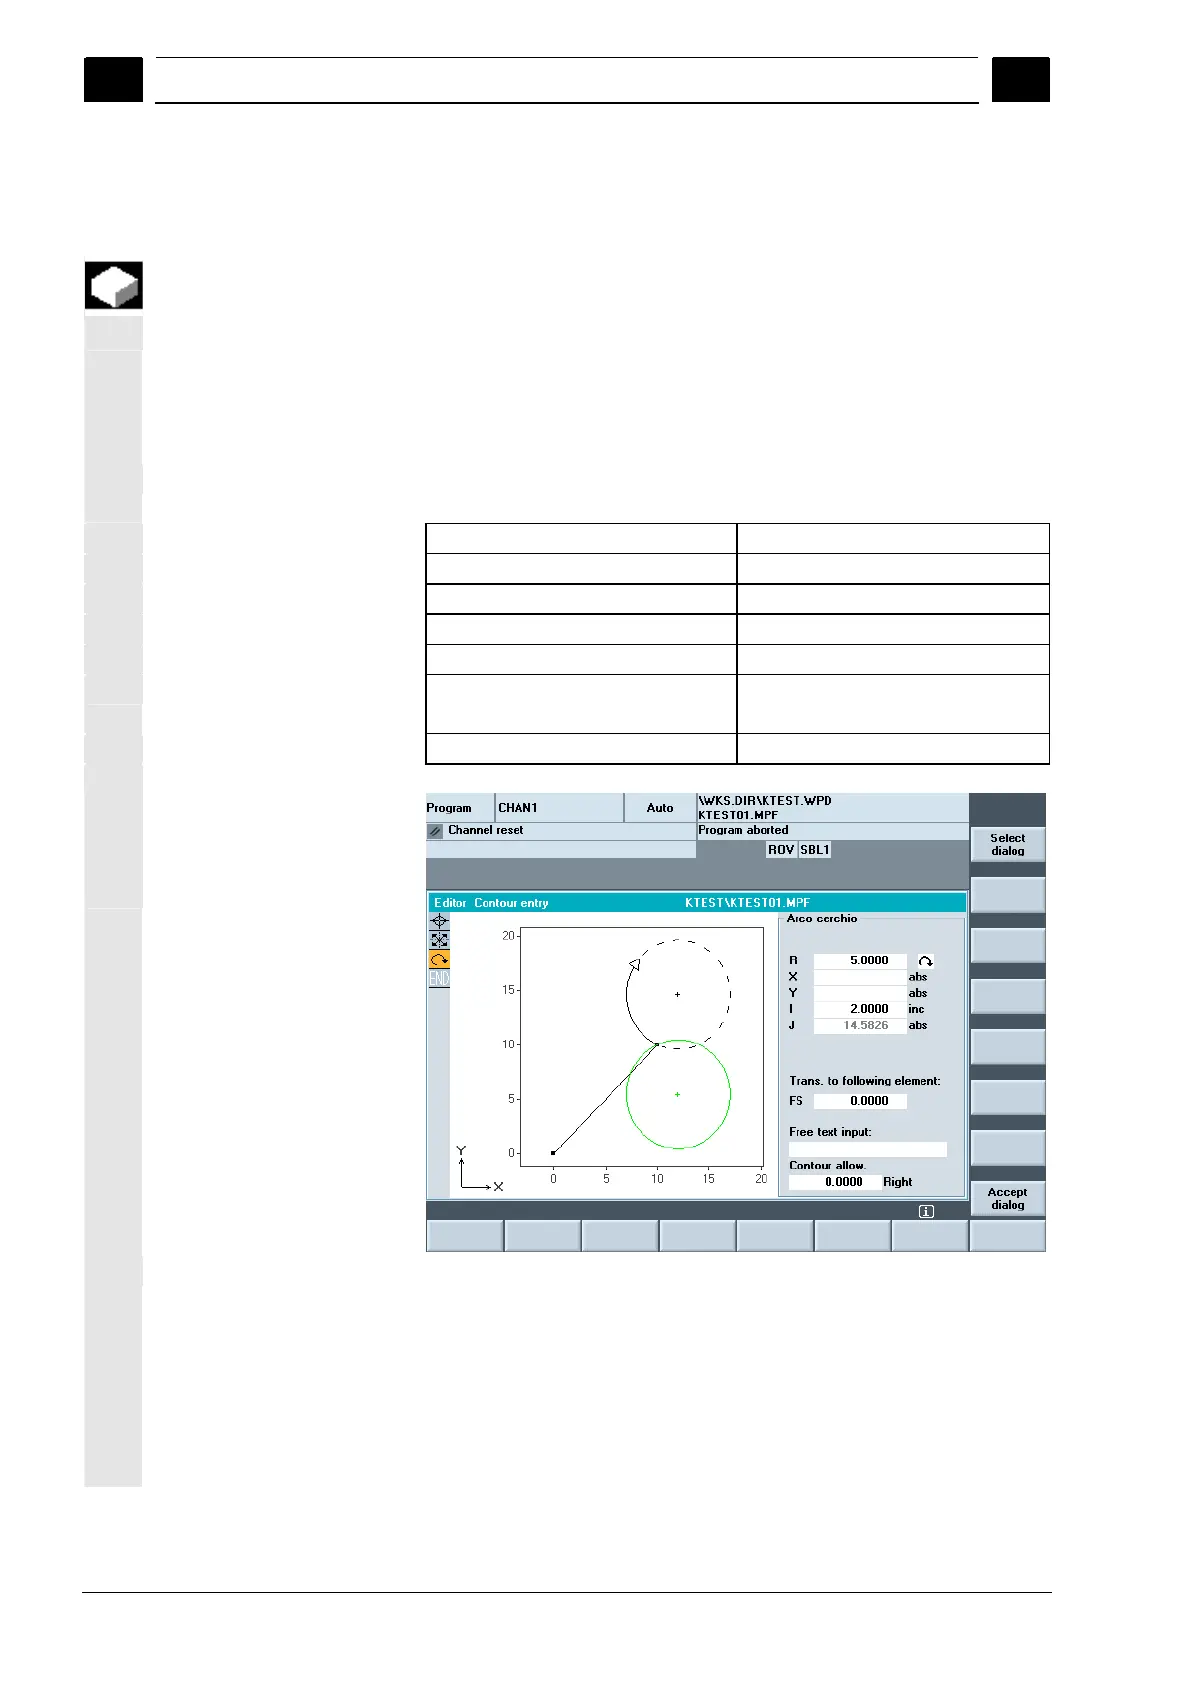
6.7.4 Graphically displaying the contour
Function
The graphics window displays the progress of the contour chain as
you configure the parameters for the contour elements. The element
you have selected is displayed in red in the graphics window.
Navigation within the contour is described in "Program contour".
The created contour element can be displayed in various line types
and colors depending on its status:
Color/line Significance
Black Programmed contour
Red Current contour element
Green Alternative element
Black continuous line Element is fully defined
Black dashed line
with a black arrow
Selected element
Light blue line Element is partially defined
The contour is displayed to the extent it can be interpreted by the
control on the basis of parameter inputs. If the contour is still not
displayed in the programming graphic, further values must be entered.
Check the contour elements you have already programmed, if
required. You may have forgotten to enter all of the known data. The
coordinate system scaling is automatically adapted to changes in the
complete contour.
 Loading...