CS8C © Stäubli 2009 – D28070504A
147 / 248
Chapter 6 - Operation
6.10.3. DEBUGGING AN APPLICATION
The VAL3 task manager (accessible via the main menu) provides access to a debugging program that supplies
the tools necessary to fine-tune tasks.
To access the debugging program, select a task and press the Dbg key in the pop-up menu. When the debugging
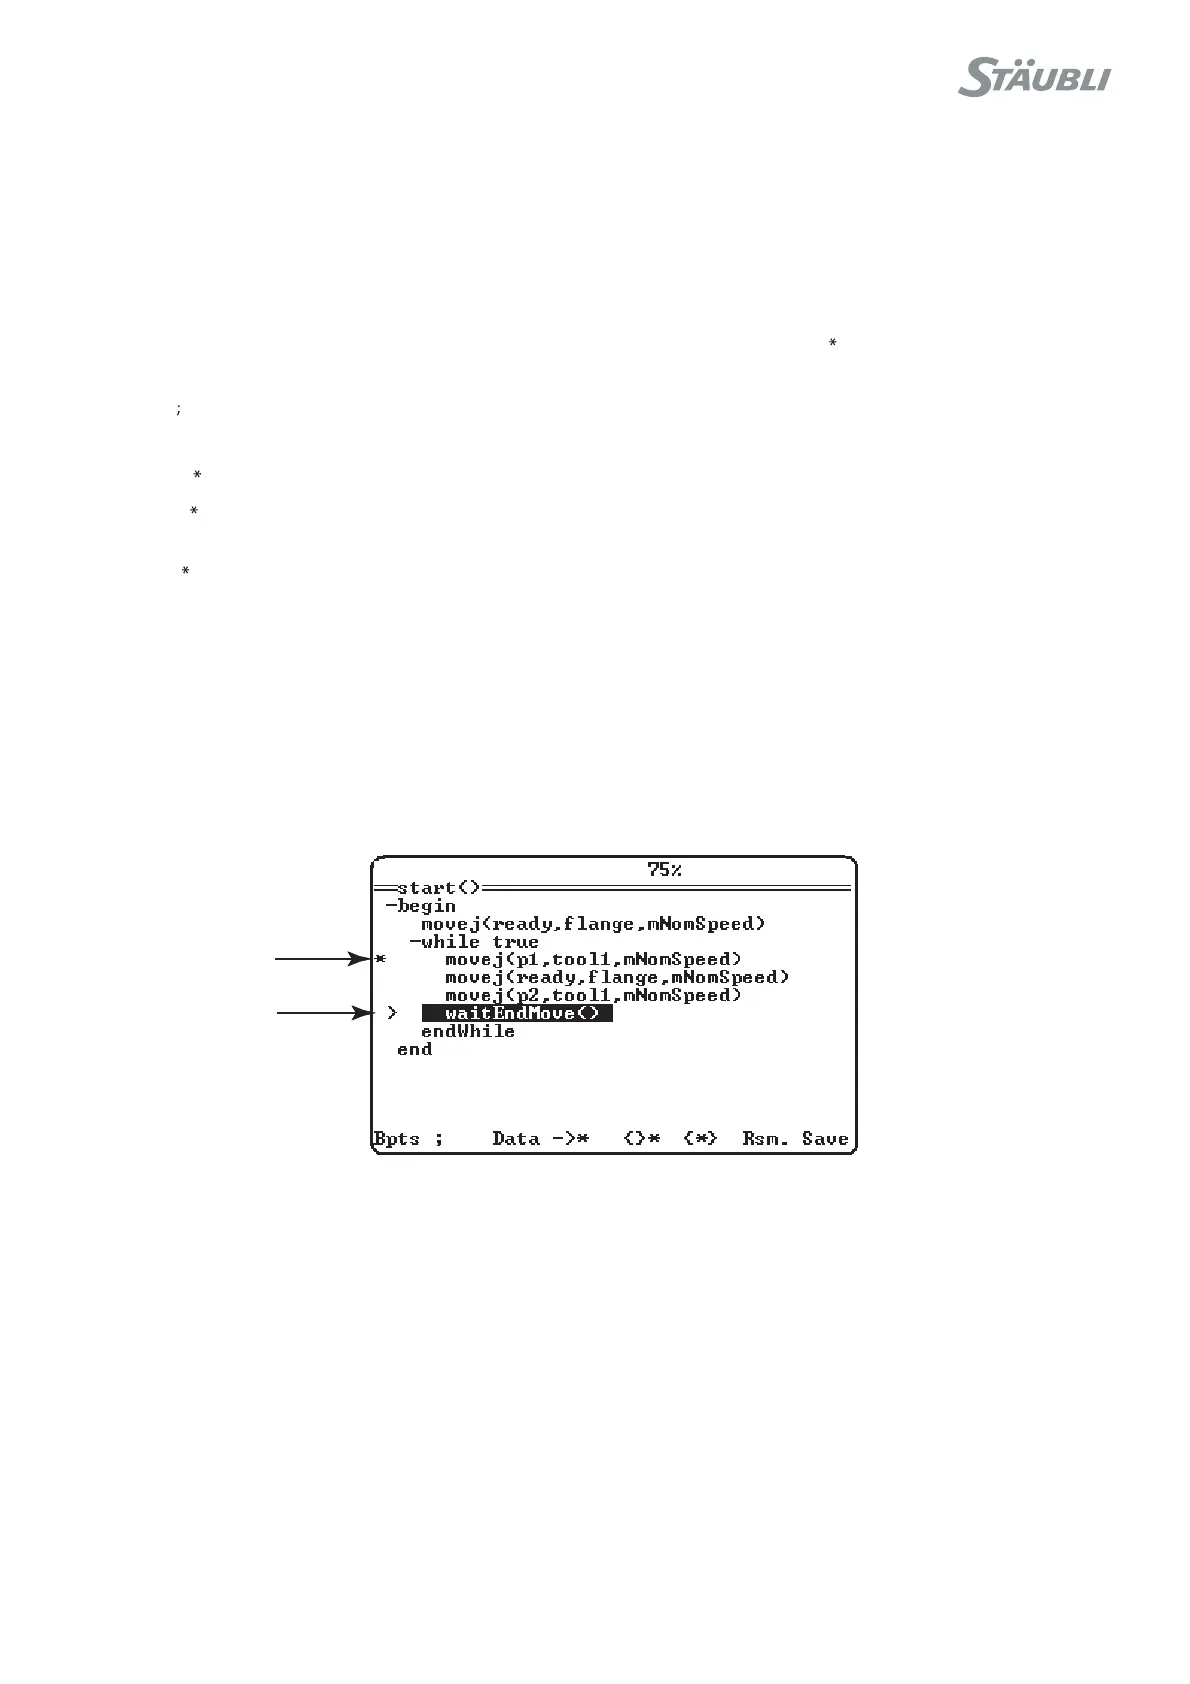
session starts, the task selected is suspended immediately and a display page is opened (see figure 6.19).
In the debugging page, the ">" program pointer(1) shows the next instruction to be carried out.
• The Bpts menu enables you to associate a break point (2) with an instruction, via a window, or to delete a break
point that has already been positioned. The stopping point is shown by the icon opposite the instruction
concerned.
• The menu enables you to add the selected instruction as a comment.
• The Data menu provides access to the variables for the instruction selected.
• The -> menu enables you to move the task pointer (1); this action does not execute any instructions.
• The {} menu activates the step-by-step mode. In this mode, the program is executed as it is shown in the
display (per display line).
• The {} menu activates the detailed step-by-step mode. In this mode, each step is equal to a VAL3 instruction
and the sets of instructions (if, while…) are expanded.
• The Rsm./Sus. menu enables you to suspend and restart execution of the task without exiting the debugging
program.
• The Save menu enables you to save the application.
To exit the debugging page, press the Esc key.
Figure 6.18
2
1