EVM: Viewing Data
EVM Panel Layout View (PLV) Page
EVM Series User Manual
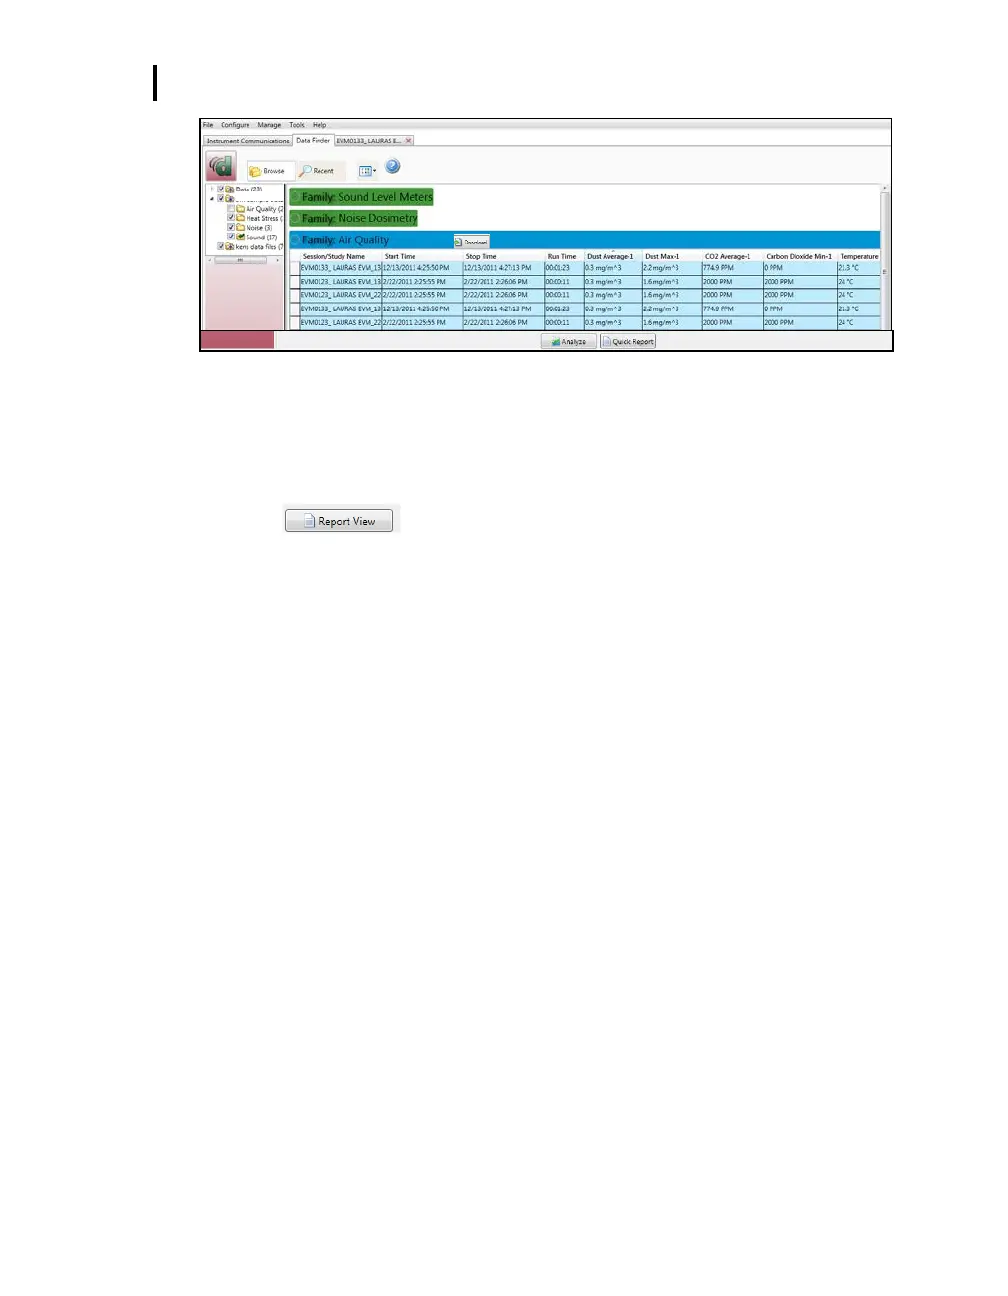
Figure 6-3: Data finder page
EVM Panel Layout View (PLV) Page
The measurements and parameters will be displayed in charts and graphs which may be customized for
analysis and/or reporting purposes.
NOTE: A button provides a quick link to viewing the panel layout view data in a
report format.
1. The PLV page is divided into Work Items (see ❶), Add panel (see ❷), Arrange Panels
(see ❸) and Data Panels (see ❹).
Work items (❶) – select either the session or study (in order to view appropriate
measurement/parameter data).
Add panel (❷) – double-click on a chart/table type and it will appear as a panel on your
screen.
Arrange panels (❸) – displays the order of the sessions/studies displayed in the panel
section of your screen.
Data Panels (❹) – used to view your measurement and/or parameters from your study.
NOTE: Use the menu bar icons and/or configure icon to customize parameters.
Toolbar and Configure button (❺) –used to customize or select different measurement
parameters.