Measuring
Understanding What Data is Stored
EVM Series User Manual
Understanding What Data is Stored
When you are performing air quality monitoring, there are two types of data stored in the instrument
which includes summary data and time history data (or logged data).
Summary Data
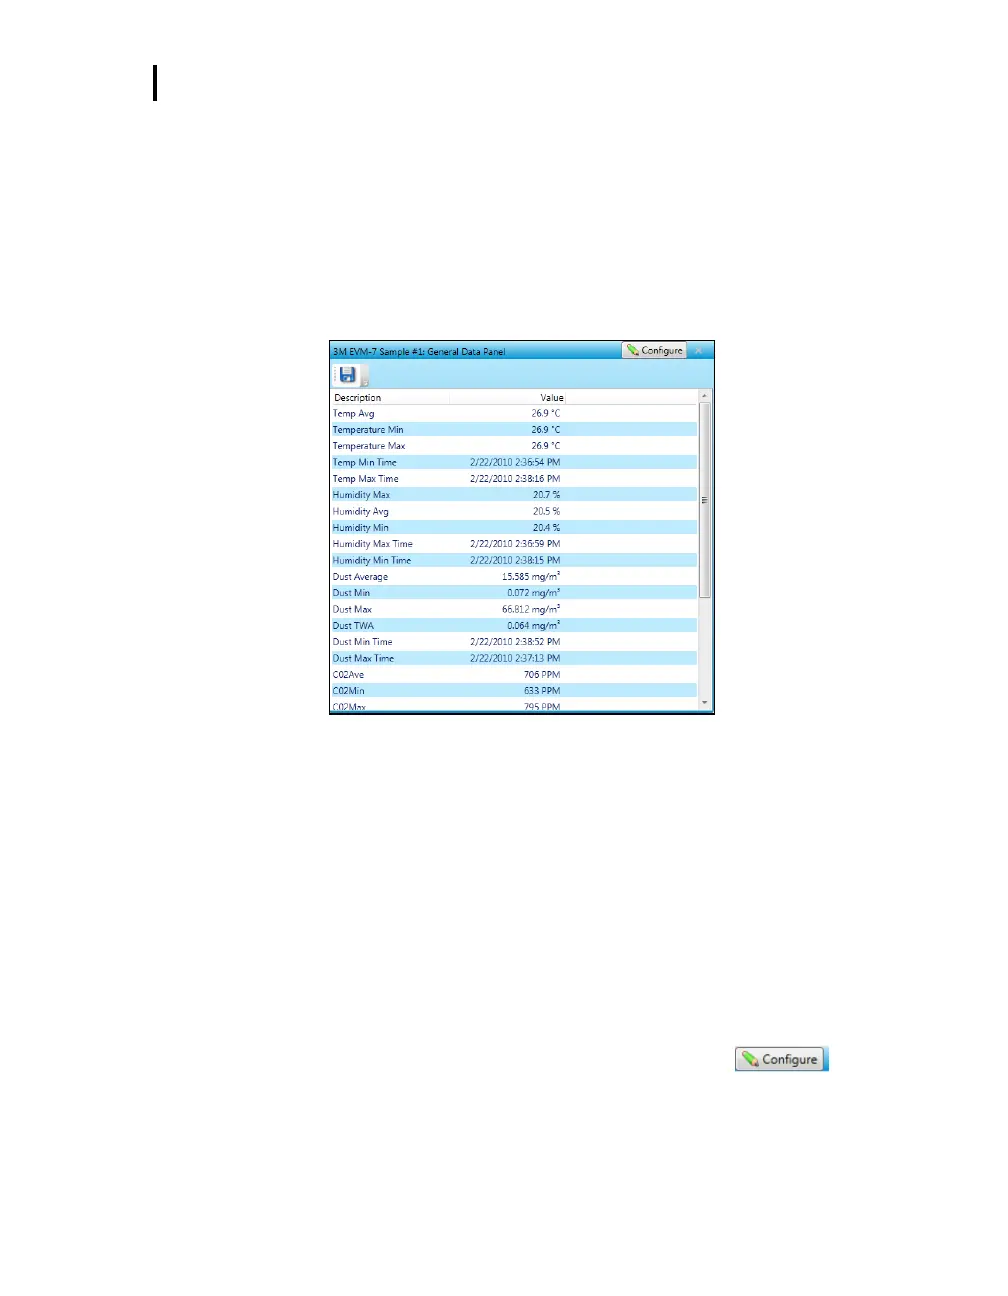
Summary data represents values that occurred over the entire run of the study. An average
measurement is the average of all arithmetic data points for a sensor (i.e., dust, humidity, CO, etc..),
Max and Min values are the highest and lowest measurements that occurred throughout the run time.
Figure 5-2: Sample summary data from a DMS table
Logged Data/Time History
Logged data, also referred to as “time history,” plots measurements with a specified logging interval
ranging from 1 second intervals to 60 minute intervals (as set up in the EVM monitors via the logging
screen).
Time History data represents measurements that occurred over the most recent time period, which is
the logging interval. For example, if the log interval is 1 minute, then the maximum value is the highest
value for that 1 minute, and the Lavg value is the average value for that 1 minute.
NOTE: DMS has two default logged data charts that appear: temperature and humidity on the first
logged chart, and Dust and CO
2
data on the second logged data chart. (If you do not have
those sensors installed, they will not appear.) In DMS, to view different sensor
measurement parameters on the logged data chart, click on the and click in
the specific sensors’ checkboxes.