Trend Data
Viewing trend data in the measurement screen
EVM Series User Manual
Trend Data
The trend data screen is a graphical logged data chart and is viewable in all the measurement screens.
Depending on the parameter you are viewing (i.e., PID sensor, Particulates, etc...), it will display the
measurement level values in a graphical format.
Viewing trend data in the measurement screen
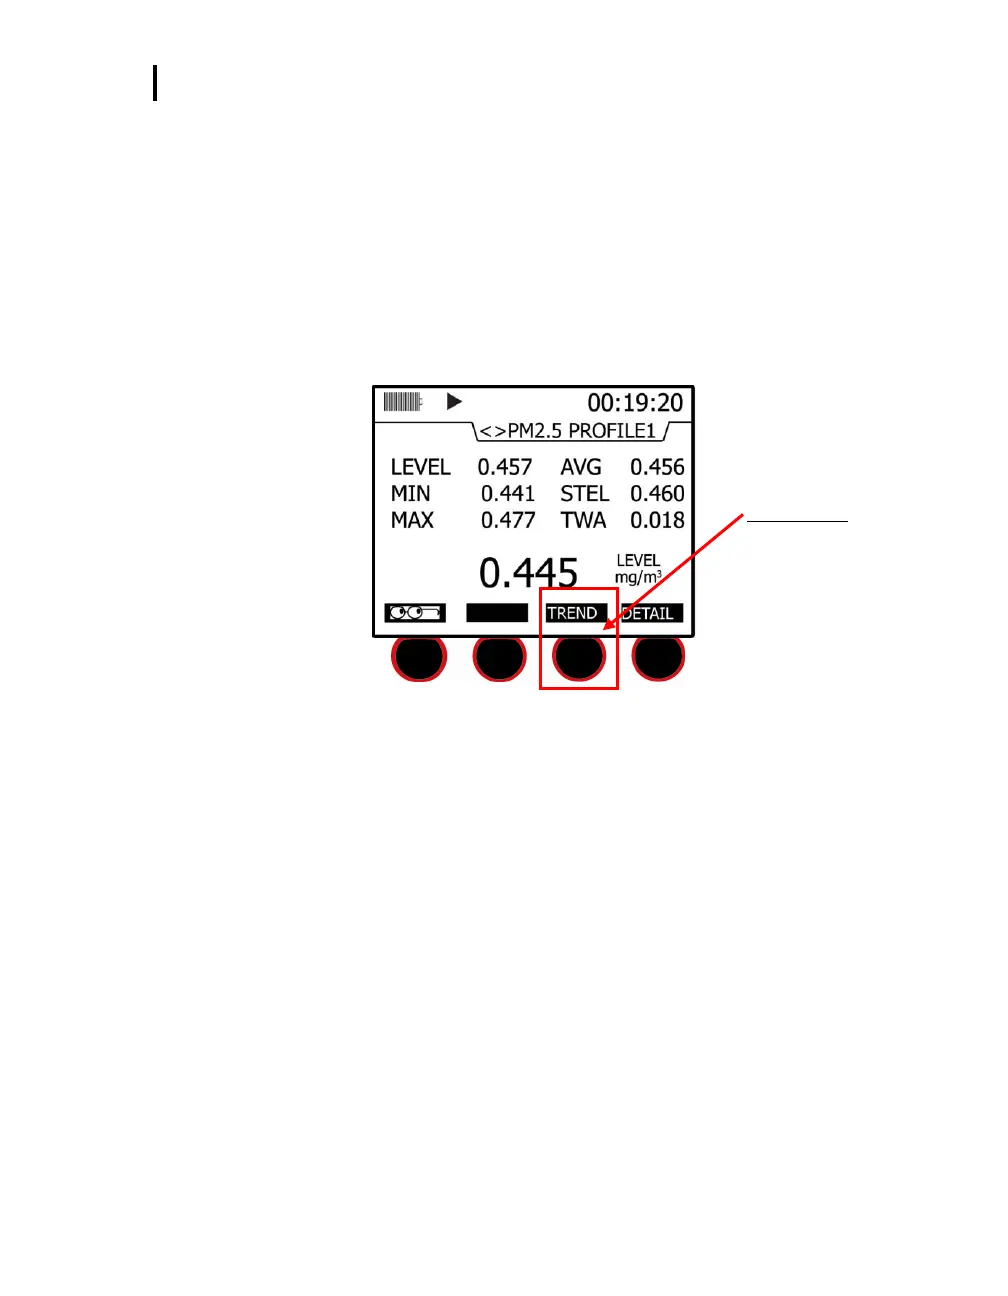
The example in Figure 5-13 displays particulate trend data with one second level values.
Trend data screen
1. To select a trend screen, first select a measurement screen you want to view.
Trend soft key
Press third soft key to view
trend data
Figure 5-13: Selecting Trend soft key
2. In the measurement screen, press the Trend soft key and a graphical data chart will appear.
You can either view the data as a “Line” format or a “Bar” chart format by pressing these soft
keys on the bottom of the display.
3. (Optional) Press the Altf key to toggle between the trend time scale units and the soft key menu.
4. (Optional) Press ▲/▼ Arrows to change the vertical range.