EVM Reports and Printing
EVM Panel Layout View (PLV) Page
EVM Series User Manual
EVM Reports and Printing
To quickly create reports, open your data (in the data finder page) and click the quick report
button. A standard template of charts and graphs (or panels) will appear in the report.
NOTE: The charts/graphs will appear in the order displayed in the panel layout page.
Viewing reports: if you are in the data layout page and you have rearranged the charts/tables,
the report will print in the sequence in which they appear on the screen.
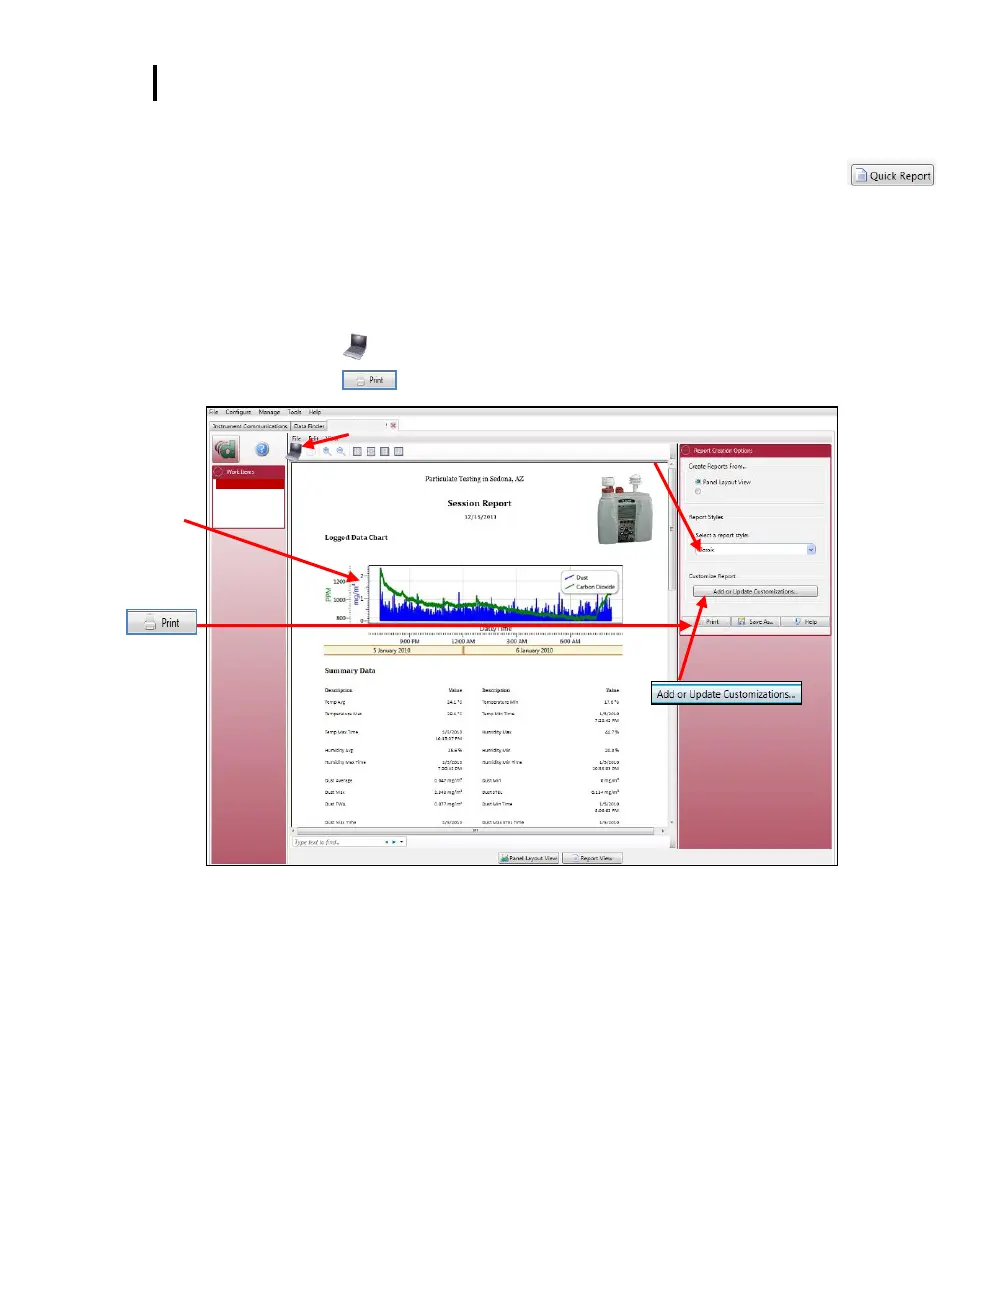
Printing reports: while in the report view page you have two options outlined below:
Click on the icon from the title bar.
Click on the icon from the session report title bar.
Figure 6-5: EVM data in a report format
EVM-7 Sample #2: Logged Data Chart – Read Only
Report example with
logged data chart
displayed with EVM data
Customize the report by
inserting on-site testing images
Customize the report by inserting on-site testing
images via the button.