EVM: Viewing Data
EVM Panel Layout View (PLV) Page
EVM Series User Manual
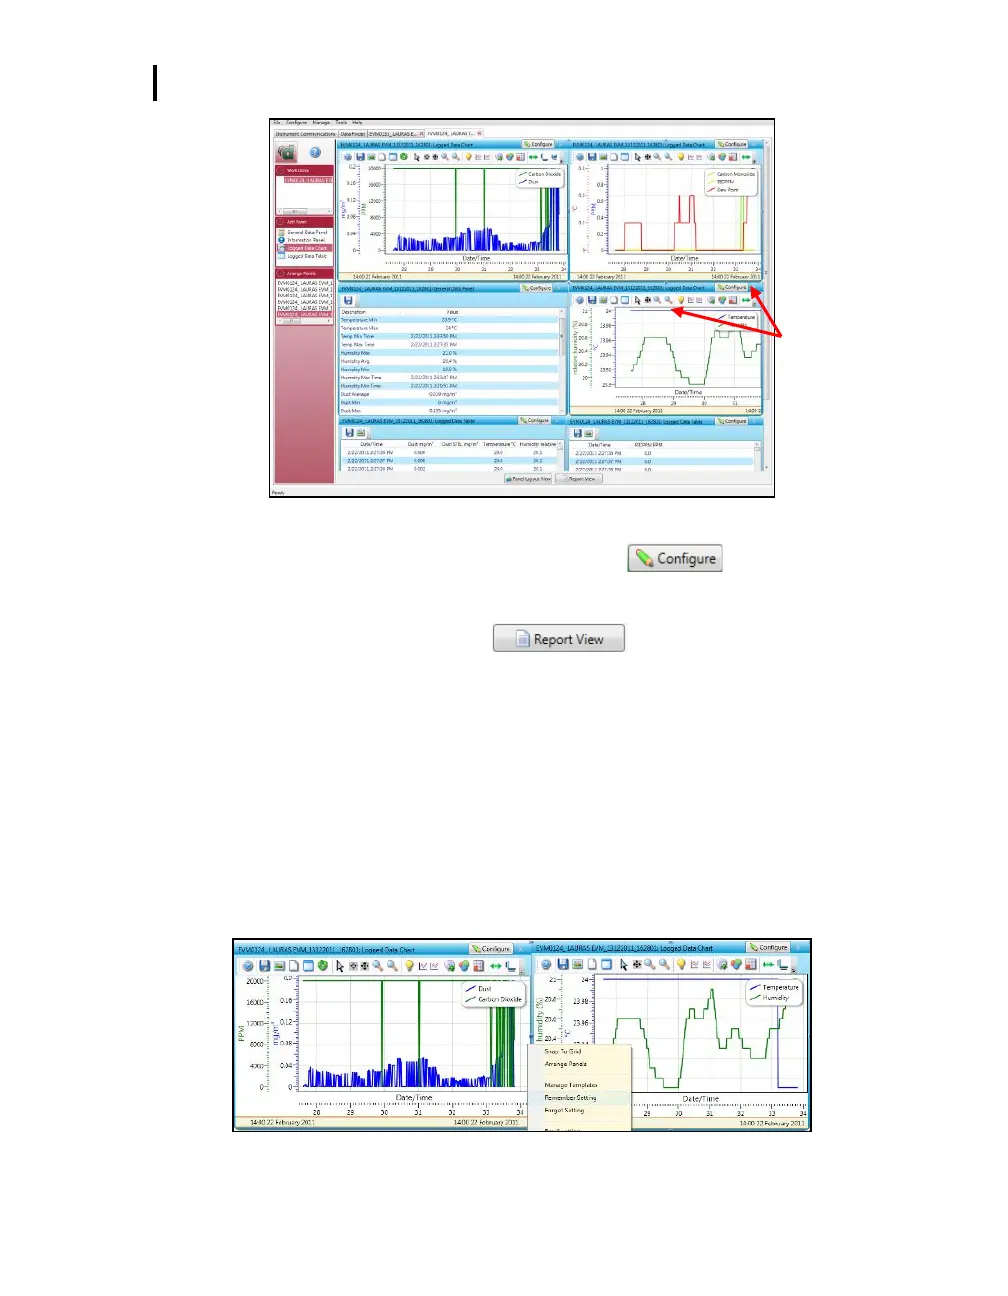
Figure 6-4: Charts and Graphs (panels)
2. To change the graph/table data parameters, click on the button. Each graph/table
may have different configurable parameters depending on the parameters applicable to the
specific panel.
3. To view the data as a report, click the button (see ❻).
NOTE: The panels will print in the order in which they are displayed in the panel layout page.
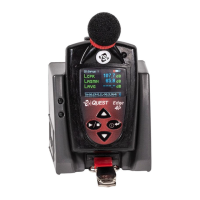
4. The quick tips below explain how to customize the panels and/or graphs/tables:
To stretch the graph/tables, click on one the corner’s edge of a chart or table and drag the
mouse. The graph/table will expand or shrink when resizing.
To move the graph, click, drag and drop to the appropriate panel position.
To change ranges, when clicking on either the x-axis or y-axis, click and drag the mouse until
the appropriate range is selected.
NOTE: It will span the numbers up or down depending on how you drag the mouse.
To save a layout, Right-click outside the tables/graphs area as displayed below. Click
Remember Setting (see ❻).
Configure button
and toolbar