5-10 Calibration
Calibration Graph window:
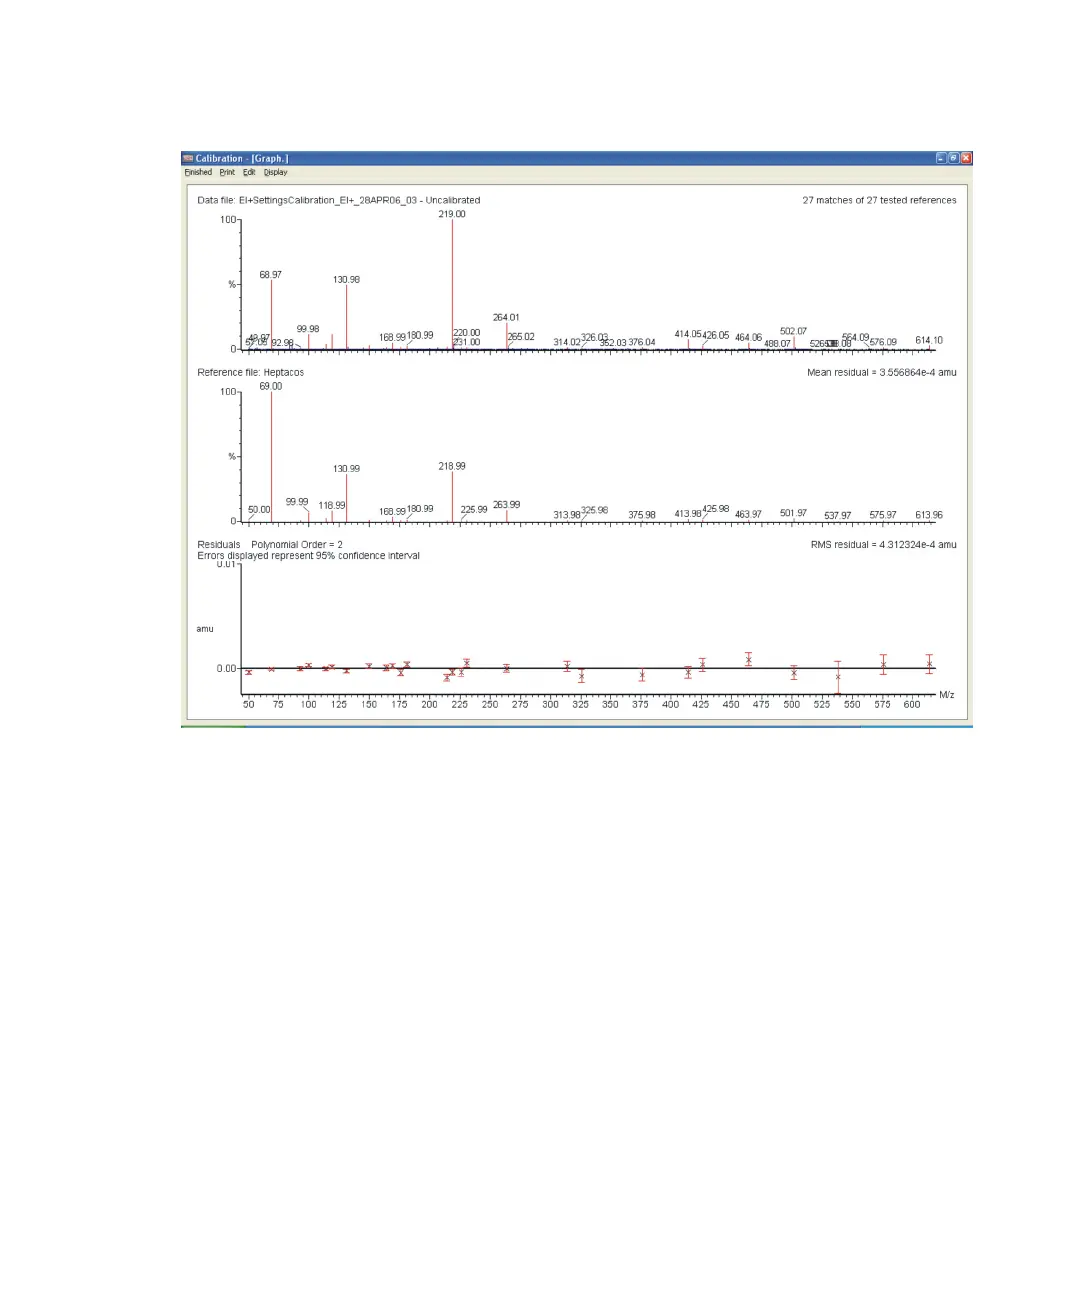
The Calibration report window comprises four sections:
• Data file: The data selected for calibration.
• Reference file: The spectrum of the selected reference file.
• Residuals: The software will have attempted to produce a
calibration that corrects the acquired data so that the reference
peaks are at the correct expected mass. The residuals graph shows
how accurately a calibration corrected the data by showing the mass
difference between the data and the calibration line.
• RMS: An average of the residuals; a good value is any value less
than 0.001.