Asynchronous Transfer Mode – ATM
Acterna ANT-5 Page 109
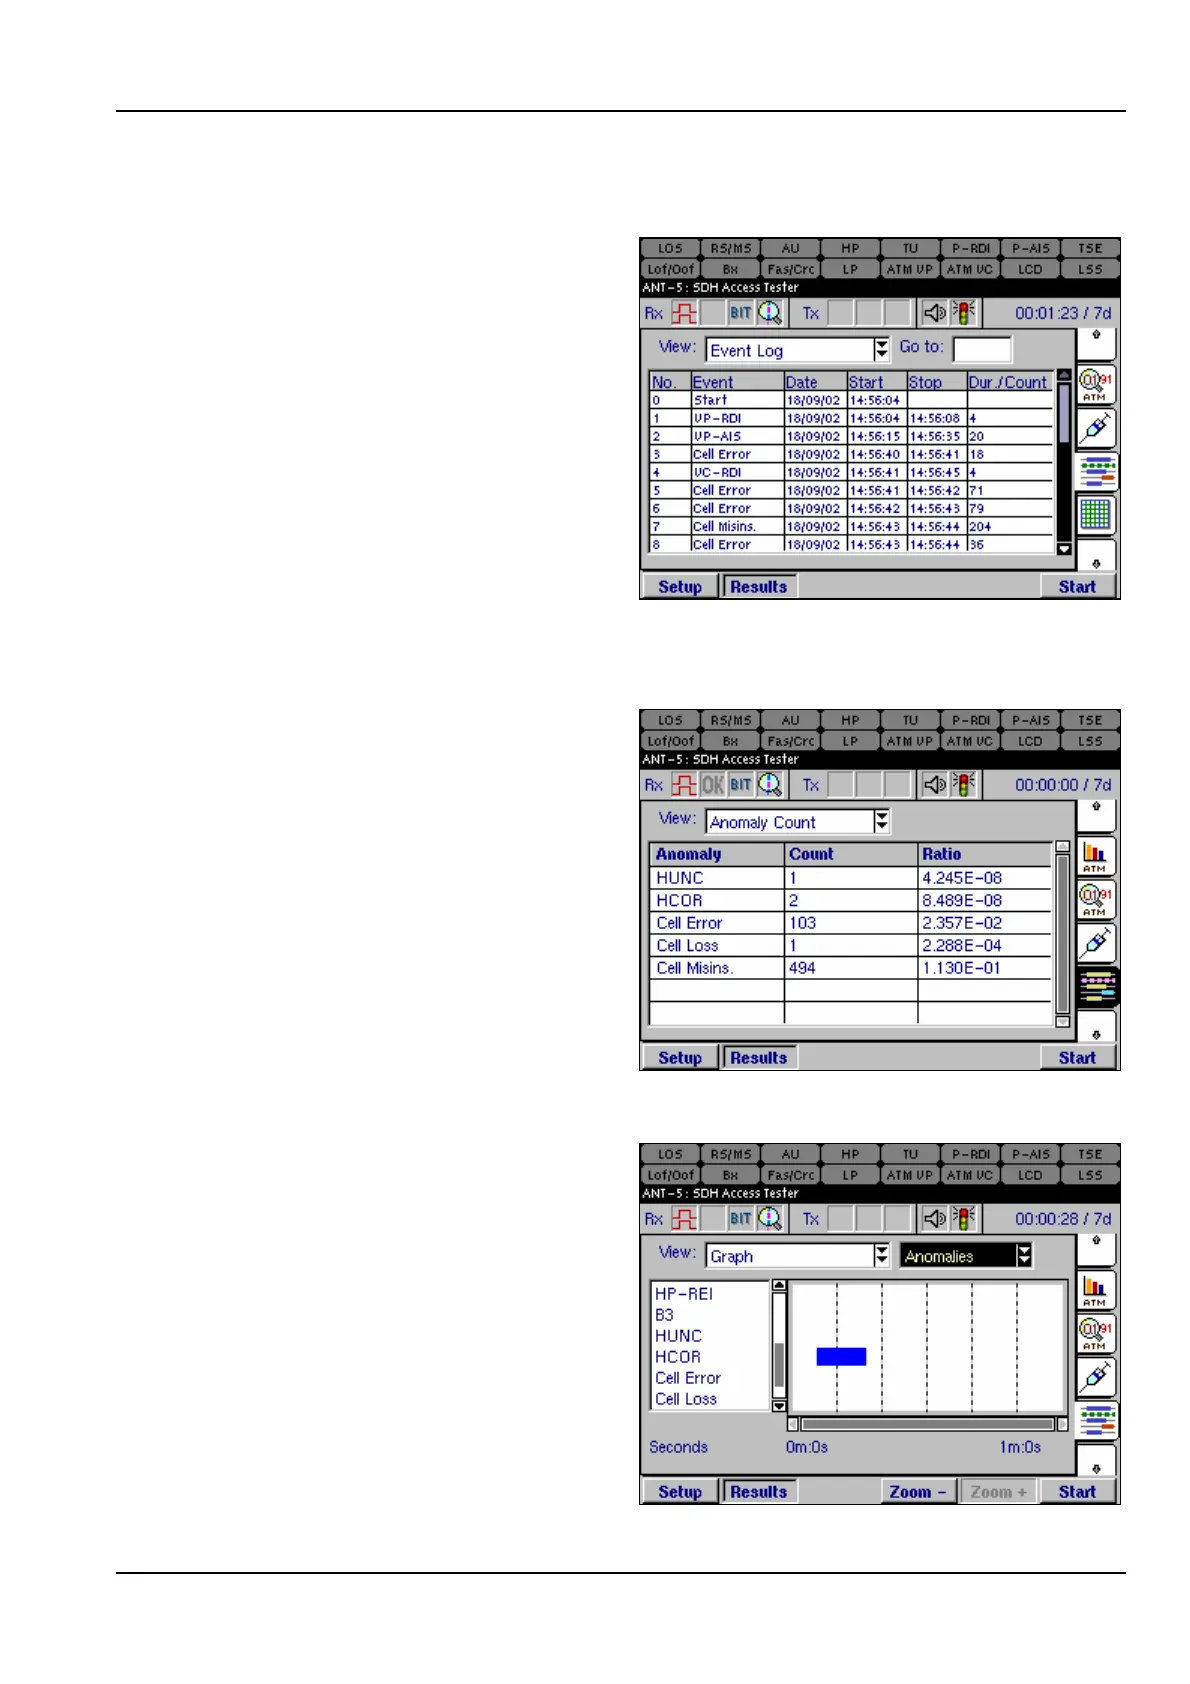
6.9.2 Event Log
The Event Log view lists ATM events
in time order as they occur during a
test, including start-time, stop-time
and duration of the defect or total
anomalies per second.
6.9.3 Anomaly count
The Anomaly Count view lists the
ATM anomalies in hierarchical order
which are relevant to the current test.
The number of anomalies occurring
during a test are counted for each
anomaly type, and the ratio of each
anomaly within the elapsed period of
test is displayed.
6.9.4 Graphs
The Graph view displays a graphical
timeline representation of ATM
anomalies or defects that have been
detected during the test. The bar
displayed indicates that an event was
detected during the time interval.
The list of anomalies or defects is
shown on the left of the chart and can
also be scrolled vertically if required.
Refer to section 4.13.4, Graphs for an
example on how to use the detailed
zoom feature. The benefit of the