The SDH Access Tester application
Acterna ANT-5 Page 69
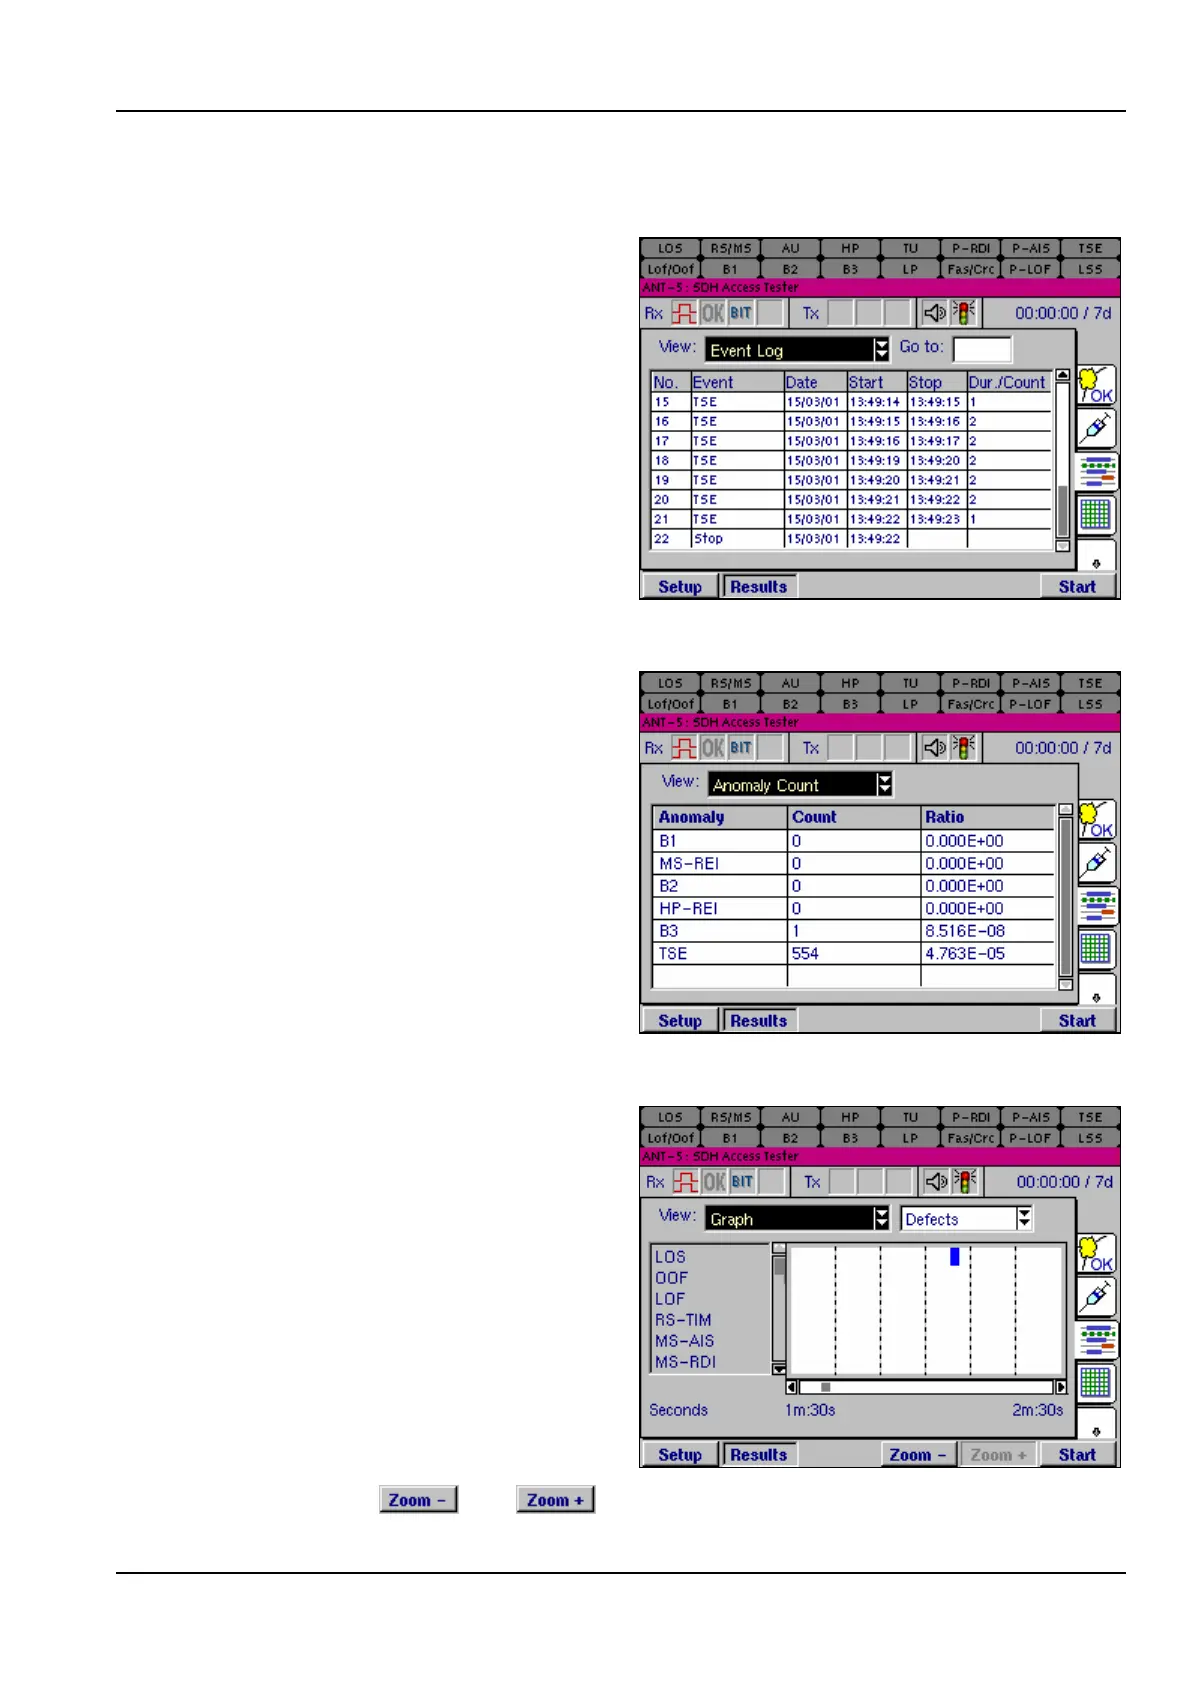
4.13.2 Event Log
The Event Log view lists all SDH and
PDH events in time order as they
occur during a test, including start-
time, stop-time, and duration of the
defect or total anomalies per second.
4.13.3 Anomaly Count
The Anomaly Count view lists all
SDH & PDH anomalies in hierarchical
order which are relevant to the current
signal structure. The number of
anomalies occurring during a test are
counted for each anomaly type, and
the ratio of each anomaly within the
elapsed period of test is displayed.
4.13.4 Graphs
The Graph view displays a graphical
timeline representation of any SDH
anomalies or defects that have been
detected during a test. The anomaly
or defect occurrences are plotted as a
set of horizontal bars against a time
axis divided into intervals of one day,
hour, minute or second. A bar is
displayed to indicate that an event
was detected during that time interval.
The time scale is shown under the
chart, and can be set to a resolution
of 60 days, hours, minutes or seconds
by pressing the and keys. Vertical columns show sub-divisions of 10