Lesson 2 – Creating a Test Method
463
2-9 Debugging Tests using Hardware
Response Emulator
This section is just an introduction of a powerful debugging tool,
the Hardware Response Emulator (Emulator). For details of this
tool, see the Test Method Programming Reference manual after
this lesson.
Overview of Emulator When you execute a testflow or testsuite(s) offline for debugging,
you may have the following two problems:
• Random and insignificant data will be returned to the test method
APIs.
• You cannot control the pass/fail results of each testsuite easily.
The SmarTest provides the tool, Hardware Response Emulator
(Emulator), to resolve the above problems. The Emulator runs in
the background of the test execution and returns already prepared
data such as analog waveform data, measurement values, pass/fail
result, and so on at appropriate points in the test as shown in the
following figure
In particular, this helps to debug your test method program that
performs calculation using the actual measurement data such as
waveform data captured by digitizers. This also helps to check the
execution flow of the testflow easily by setting the pass/fail state
for each testsuite.
Further, you can enable or disable the Emulator easily without
changing your method program and testflow. This means you can
easily start online debug soon after the end of offline debug, and
you can easily return to offline debug.
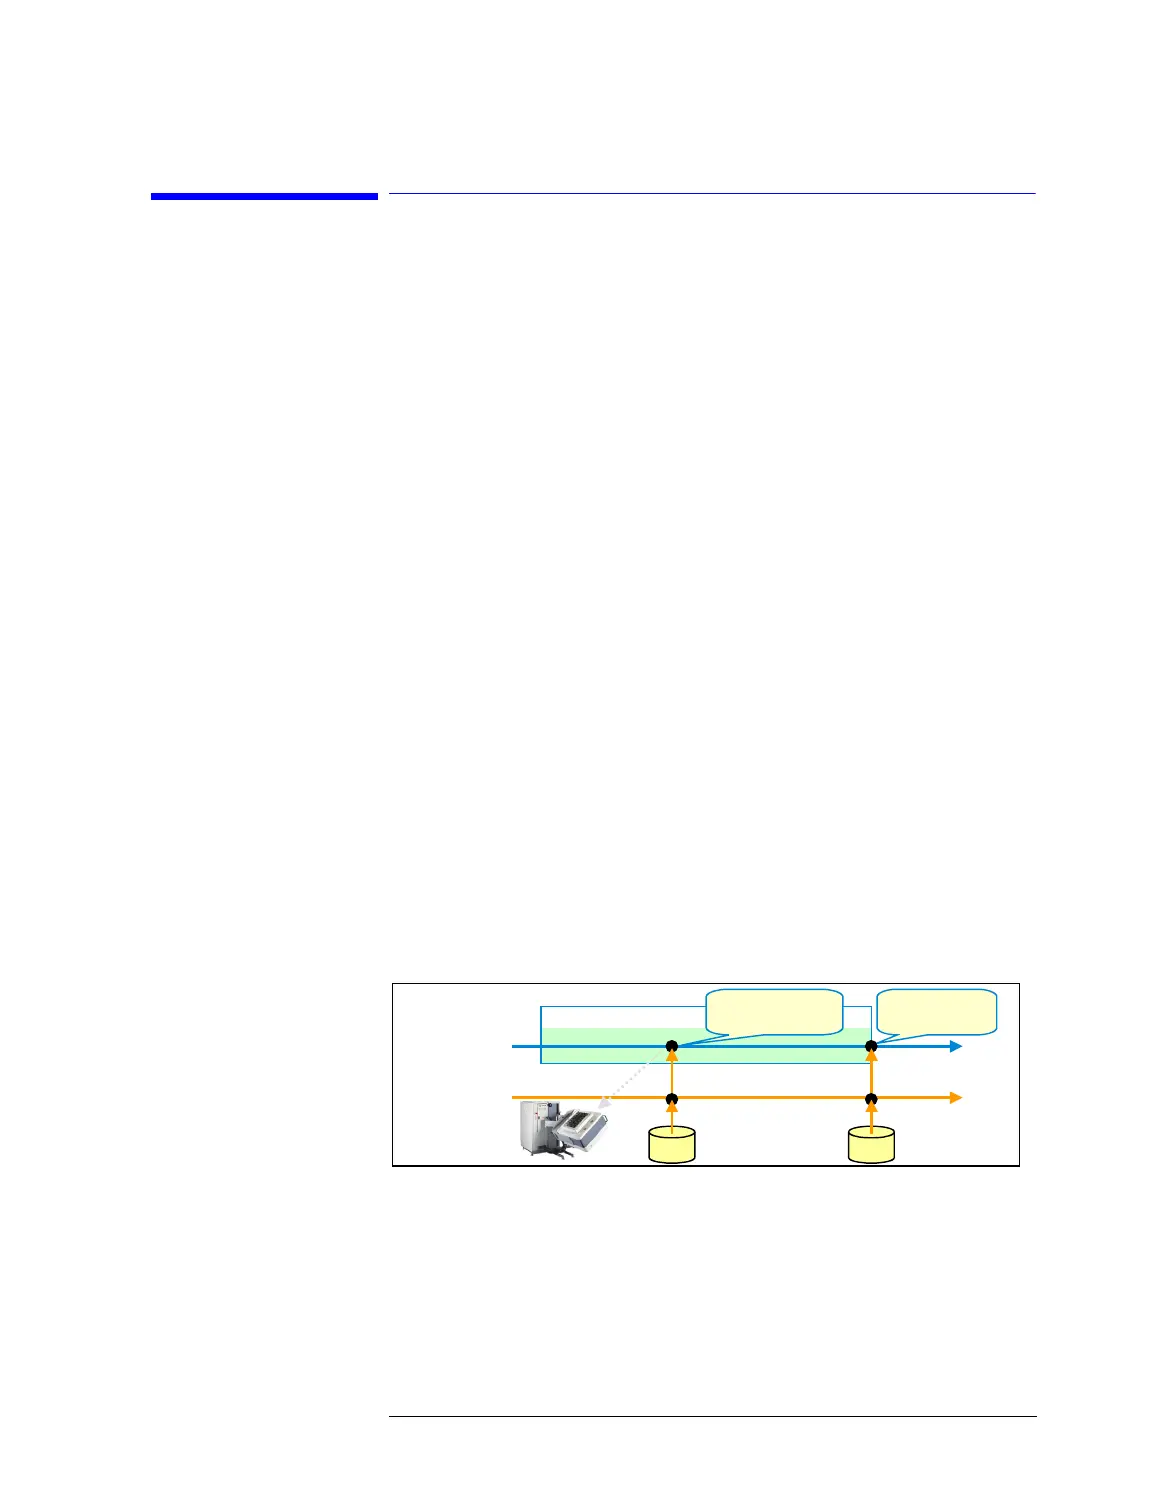
Offline Debugging using Emulator
Test Execution
Emulator
(Import mode)
File File
Return hardware
response data
Return test result
data (pass/fail)
Offline Mode:
Not Access
(Test Method Program)
Testsuite
API for retrieving
hardware response
Judge pass/fail
of testsuite

 Loading...