CHAPTER62 Syslog and Debug Recording
Mediant 800 Gateway & E-SBC | User's Manual
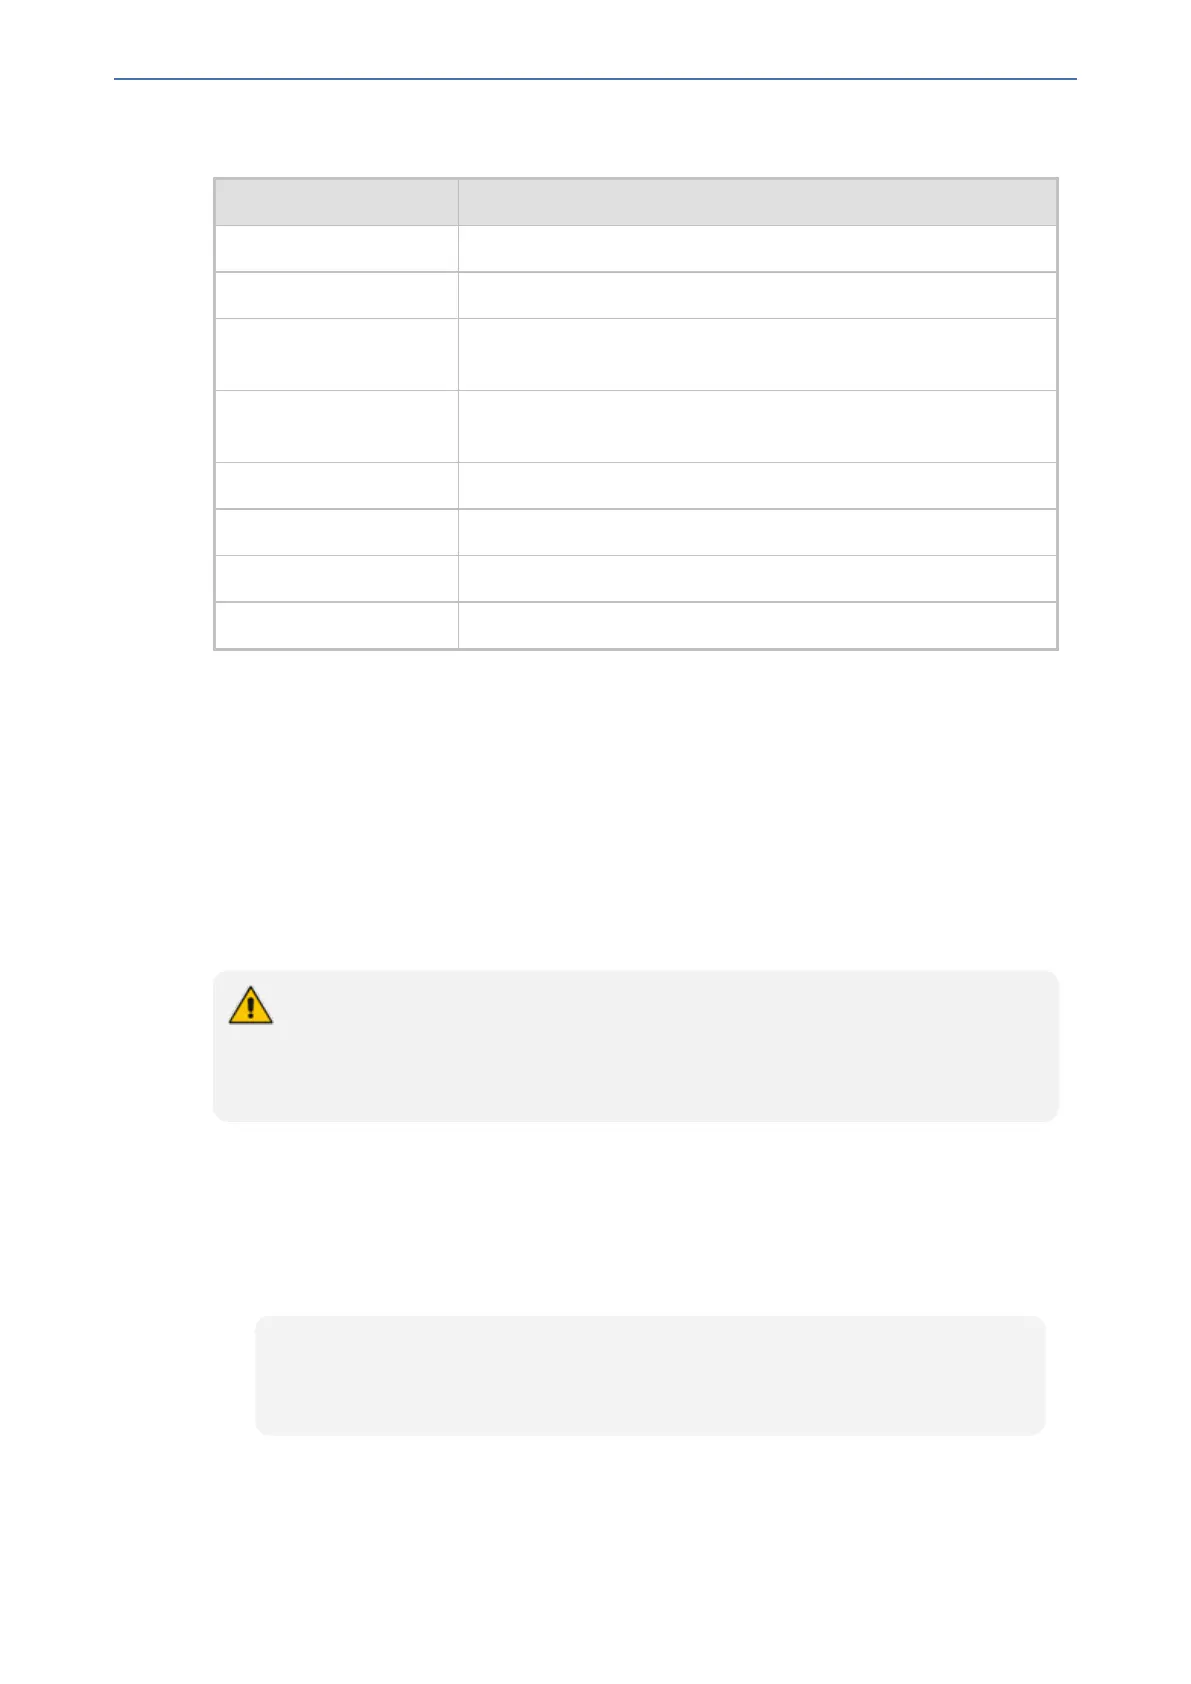
Table 62-2: Supported Wireshark-like Expressions for 'Value' Parameter
Expression Description
ip.src, ip.dst Source and destination IP address
ip.addr IP address - up to two IP addresses can be entered
ip.proto IP protocol type (PDU) entered as an enumeration value (e.g., 1 is
ICMP, 6 is TCP, 17 is UDP)
udp, tcp, icmp, sip, ldap,
http, https
Single expressions for protocol type
udp.port, tcp.port Transport layer
udp.srcport, tcp.srcport Transport layer for source port
udp.dstport, tcp.dstport Transport layer for destination port
and, &&, ==, <, > Between expressions
Below are examples of configured expressions for the 'Value' parameter:
■ udp && ip.addr==10.8.6.55
■ ip.src==10.8.6.55 && udp.port>=5000 and udp.port<6000
■ ip.dst==10.8.0.1/16
■ ip.addr==10.8.6.40
For conditions requiring the "or" / "||" expression, add multiple table rows. For example, the
Wireshark condition " (ip.src == 1.1.1.1 or ip.src == 2.2.2.2) and ip.dst == 3.3.3.3" can be
configured using the following two table row entries:
1. ip.src == 1.1.1.1 and ip.dst == 3.3.3.3
2. ip.src == 2.2.2.2 and ip.dst == 3.3.3.3
● If the 'Value' parameter is undefined, the device records all IP traffic types.
● You cannot use ip.addr or udp/tcp.port together with ip.src/dst or
udp/tcp.srcport/dstport. For example, "ip.addr==1.1.1.1 and ip.src==2.2.2.2" is an
invalid configuration value.
Debugging PSTN Calls through CLI
You can also troubleshoot and debug digital (PSTN) calls through the device's CLI.
■ To configure the debug (trace) level: The debug (trace) level determines the level of
information included in the PSTN trace. For all PSTN traces, the trace level is configured per
PSTN interface, using the following command:
configure voip > interface {e1-t1|bri} {Slot/Port} > trace-level {full-isdn|full-isdn-with-
duplications|layer3|layer3-no-duplications|no-trace|q921-raw-data|q931|q931-q921-raw-
data|q931-raw-data}
For example:
- 1102 -
 Loading...