8-7.1
Frequency Response Function
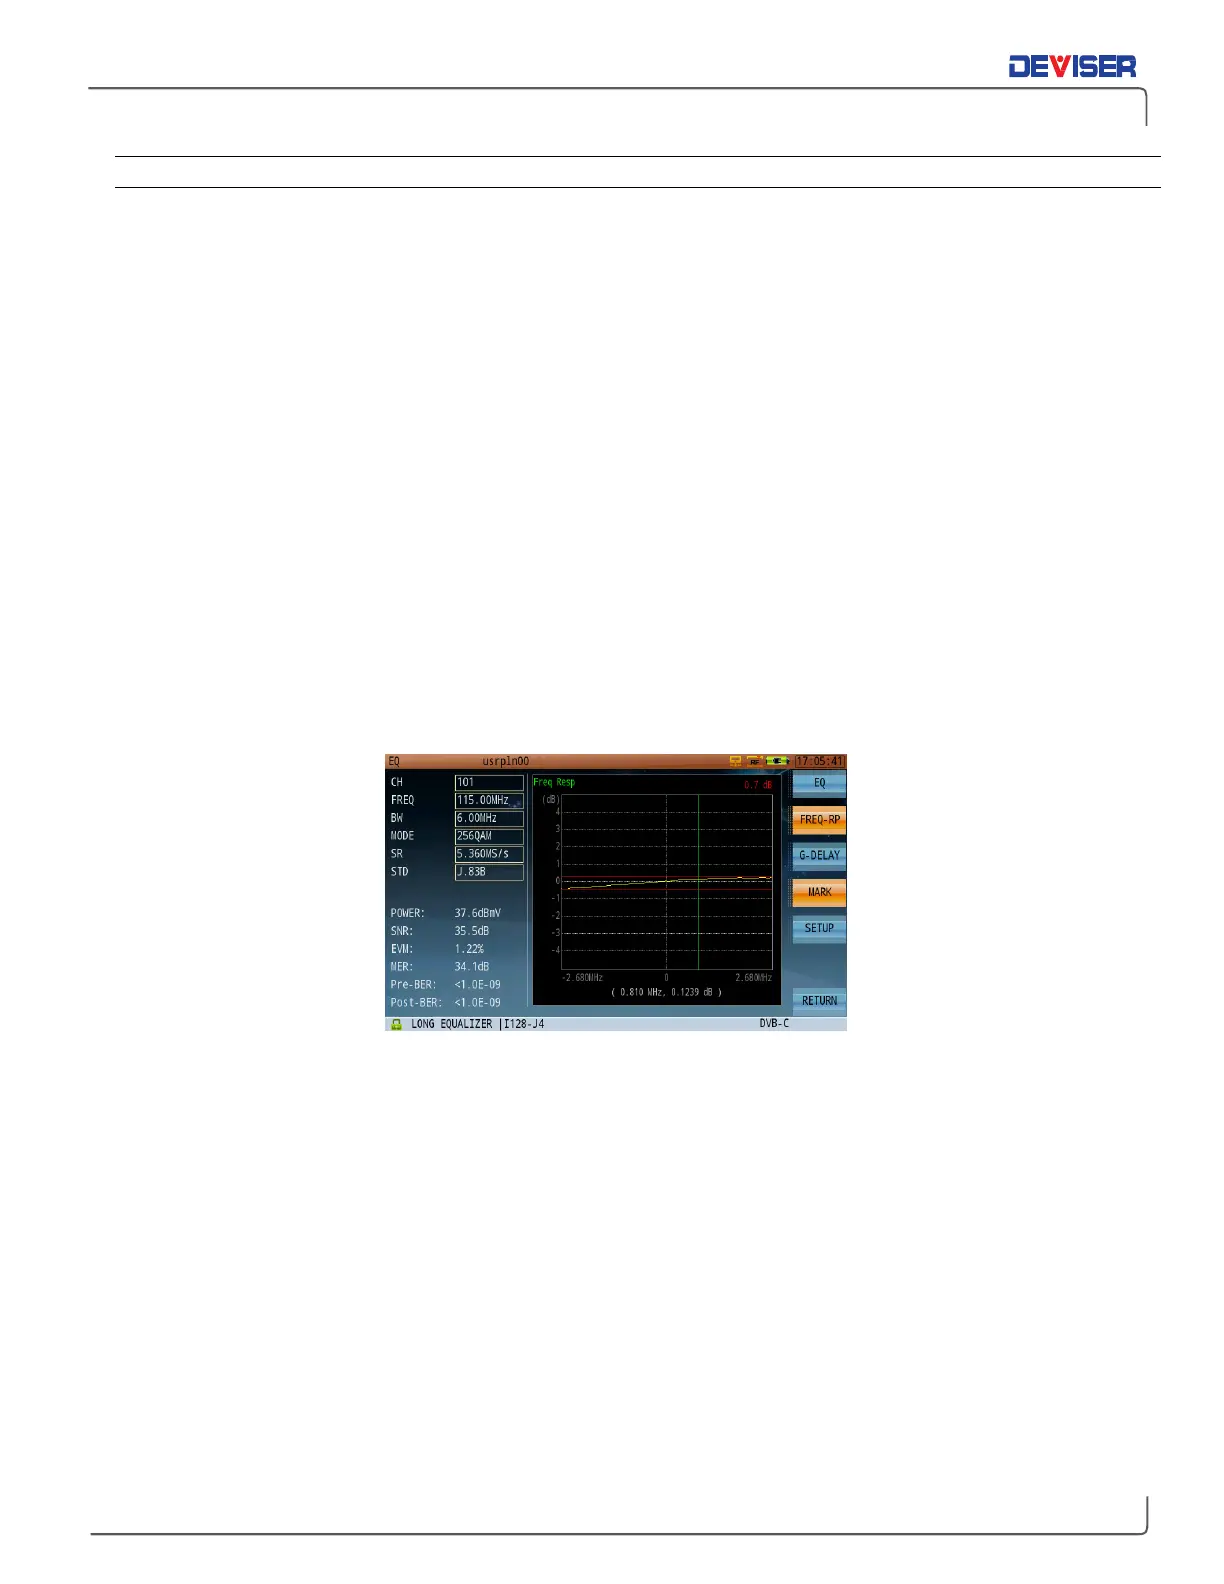
The frequency response menu is used to measure in-band flatness of the selected channel. There are two
horizontal markers which will detect min/max automatically and provide you with flatness information in dB
displayed at the top right corner of the graph. A vertical marker is available for frequency and amplitude
information at every point of the curve; turning the rotary knob will provide this information at different
frequencies. The data is displayed at the bottom of the screen.
In this mode, if there is an impedance mismatch somewhere downstream of the measurement location, the
DS2831 will display "standing waves" in the frequency response trace. You can determine the approximate
distance to the fault or impedance mismatch by using the following formula:
D = 492(VP/F)
D = distance in feet to the impedance mismatch
VP = coaxial cable's velocity of propagation (generally 87% or 0.87)
F = frequency in MHz separating each standing wave ripple—that is, the bandwidth spanned by one cycle
of the standing wave
For example, assume a standing wave is visible in the sweep receiver’s frequency response display, and
there is 0.4 MHz from the peak of one ripple to the next. If the feeder cable VP is 87% (0.87), then the
distance to the fault is just under 1100 feet.
D = 492(0.87/0.4) D = 492(2.18) D = 1070 feet
In-Band Frequency Response Analysis