Chapter 11:
Persistence Analysis
11-1
Introduction
to Persistence Theory
Spectrum persistence analysis is the latest in digital processing technology, usually found in much more
expensive equipment. With the DS2831 and other powerful test equipment, Deviser has introduced this
technology into more cost-effective equipment, providing an ideal solution for CATV operators.
Persistence testing can capture a “bursty” (interfering-undesired) signal hiding under a bursty Bonded US
DOCSIS (desired) signal – or even Common Path distortions whose low levels make them difficult to detect.
Traditional spectrum analysis is often incapable of isolating these undesired interfering signals unless desired
signal transmissions are turned off. Persistence technology captures “bursty” signals and displays them in an
easy-to-read display.
Interfering lower level bursty signals are often found under the desired signals, and detection can pose a
significant challenge. Persistence technology can help you capture, isolate and visualize hard-to-find
signals, similar to the EVS function (Section 8-5). EVS technology is used to find those continued broadcast
QAM signal covered interference signals at higher frequencies, while persistence technology is mostly used
to find those TDMA covered interference signals.
For a more thorough treatment of the DS2831’s DPS function, see the Application Note: A Study of Digital
Persistence Analysis (pg. 155) following Chapter 28 of this user guide.
11-2 Introduction to Persistence Technology
To open the Persistence function from the
Home
menu, first press
Upstream
(F2) then select
DPS
.
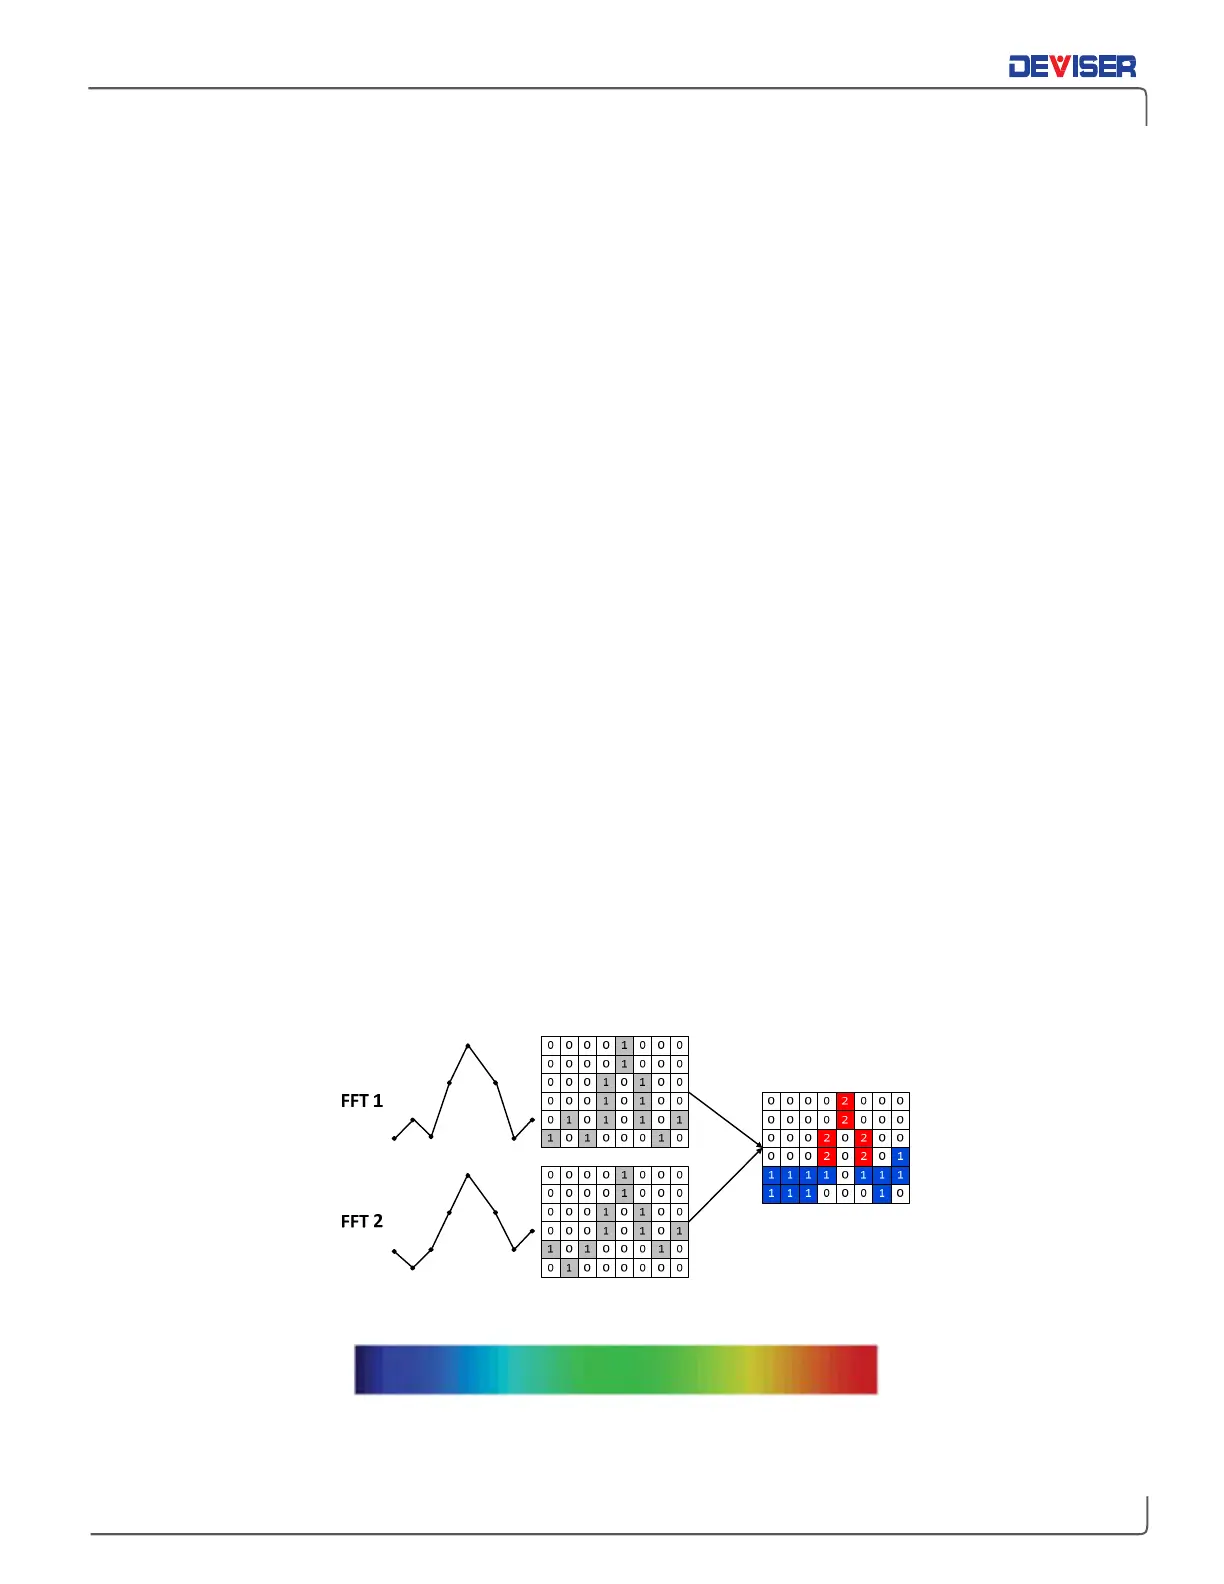
A persistence waveform is a bitmap, not a trace. In this mode, every pixel uses a different color (shown
below), based on how often the signal occupies the same pixel. A “cold” color (blues and indigos) shows a
pixel with less signal presence, and a “warm” color (reds and oranges) shows a pixel with a high presence
of signal. In the DPS display mode, when the sweep time is increased or decreased, the waveform color
display will dynamically adapt to the new setting in a real time mode. In the DPS mode, the sweep time
range is 20ms to 25secs.
Persistence principle
Persistence Wave Color Display Range